Bullish or bearish prescription?
- Health care, pharma negative for the year
- ABT trading at lowest level since 2020
- Stock has posted 10-straight down weeks
At the beginning of this week, the S&P 500 (SPX) pushed to yet another record high and nine of its 11 sectors were in positive territory for the year. Within the weakest sector—health care—the pharmaceutical industry was the second-strongest group, although it still had a negative year-to-date return.
That performance may raise a few eyebrows, given the enormous popularity of GLP-1 weight-loss drugs. But even Eli Lilly (LLY)—the strongest of the “weight-loss stocks”—is down roughly 9% this year.
Other well-known pharma stocks have had an even rougher start to 2026—including Abbott Laboratories (ABT), which on Monday was down approximately 34% for the year. The stock is coming off its first-ever streak of 10 consecutive down weeks—a milestone that may have gone unnoticed if the stock hadn’t been a fixture on the LiveAction scan for 52-week lows for several weeks:
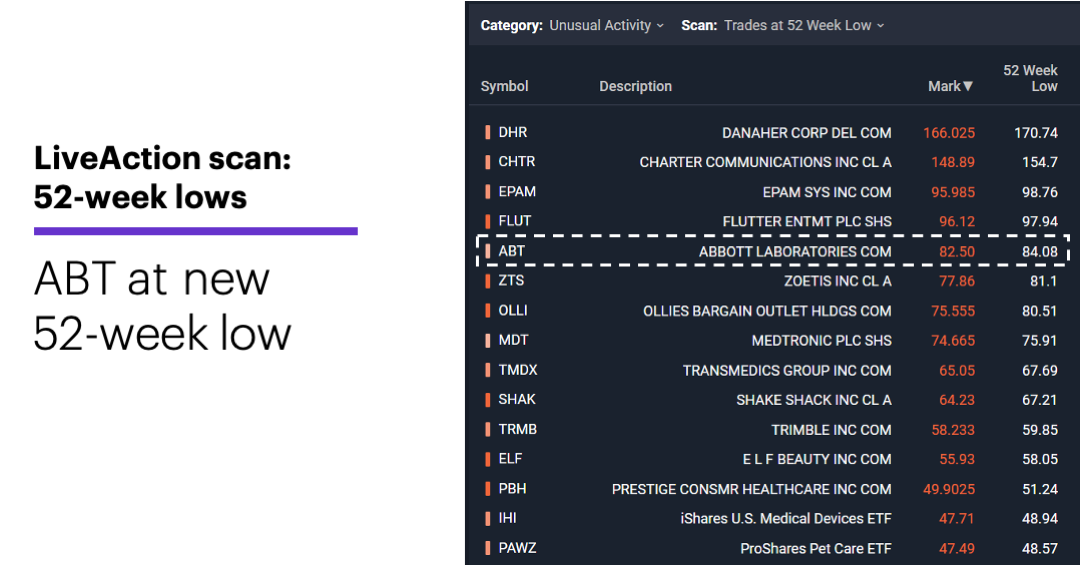
Source: Power E*TRADE. (For illustrative purposes. Not a recommendation.)
The current sell-off has actually dropped ABT to levels it hasn’t seen since April 2020, when it was attempting to rebound from the COVID sell-off.
That may be one of the most interesting aspects of ABT’s current condition: Unlike comparable corrections, this one hasn’t occurred during a period of broad market turmoil. For example, prior to last week, the stock hit a 26-week (or longer) low while also falling 20% or more over the most recent 10 weeks only 15 other times. Most of these weeks were clustered around few well-known, market-wide bearish events:
1. three weeks in October-November 1987 (“Black Monday” crash).
2. four weeks in June-July 2002 (bear market following the dot-com implosion).
3. four weeks in April-May 2009 (end of the Financial Crisis sell-off).
4. one week in March 2020 (COVID sell-off).
In contrast, ABT’s two most recent weekly lows have coincided with SPX record highs. A weekly chart shows ABT moved mostly sideways for the better part of a year after nearly matching its record high in January 2025. The current sell-off appeared to be jump started by the company’s January earnings release:
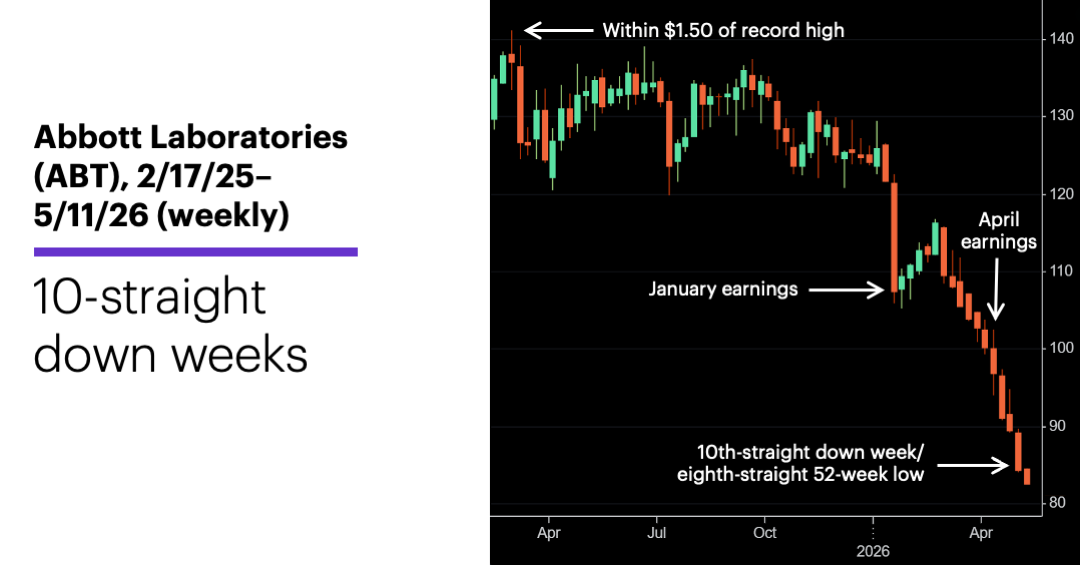
Source (data): Power E*TRADE. (For illustrative purposes. Not a recommendation.)
The similar corrections in the past suggest more volatility is possible—i.e., an initial 26-week (or longer) low accompanied by a 20%-or-larger 10-week decline wasn’t usually a “one-and-done” reversal event. However, eight weeks after ABT first established one of these lows (which it last did on May 1), shares were higher eight weeks later in all 15 cases.
That doesn’t mean the stock will accomplish the same feat this time, but it may put the ticker on the trading screens of a few bargain hunters in the days and weeks to come.
Market Mover Update: The SPX closed higher Monday despite a 2.8% crude oil rally that pushed the price of the June WTI futures contract above $98.
JFrog (FROG) pulled back Monday after jumping more than 24% on Friday after releasing earnings (see “Focus on earnings?”).
Today’s numbers include (all times ET): NFIB Small Business Optimism Index (6 a.m.), CPI (8:30 a.m.).
Today’s earnings include: First Majestic Silver (AG), Cisco (CSCO), Karooooo (KARO), Oklo (OKLO).
Click here to log on to your account or learn more about E*TRADE's trading platforms, or follow the Company on Twitter, @ETRADE, for useful trading and investing insights.
1 All figures reflect ABT weekly closing prices, 1980-2026. Supporting document available upon request.