Tech still in driver’s seat
- Earnings season rolls on, market hits new highs
- Tech stocks jump, energy sector falls with oil
- This week: CPI and PPI, retail sales, US-China summit
The US stock market continued its ascent last week, supported by more than 1,500 earnings announcements that mostly topped forecasts, especially in tech.
With the Iran conflict still looming in the background, traders and investors continued to focus on positive developments and shrug off potentially negative ones. The S&P 500 (SPX) posted its biggest gain of the week last Wednesday when crude oil prices tumbled roughly 7%, and rallied again on Friday despite reports late Thursday that the US and Iran had exchanged fire in Strait of Hormuz.
The week ended with a stronger-than-forecasted monthly jobs report and the SPX closing a fresh record high:
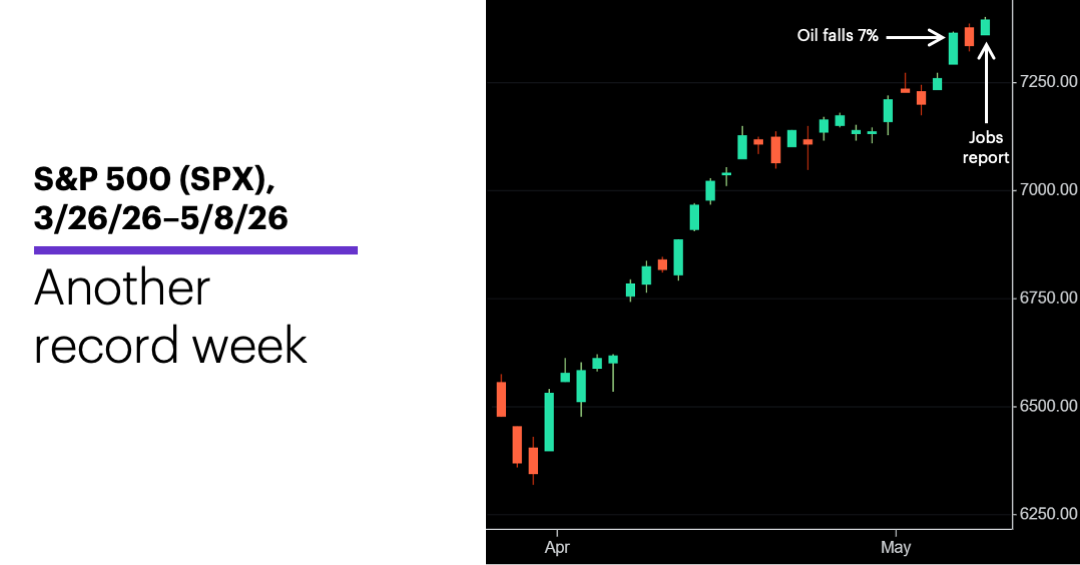
Source: Power E*TRADE. (For illustrative purposes. Not a recommendation. Note: It is not possible to invest in an index.)
The headline: Market in “risk-on” mode as earnings season continues to top expectations.
The fine print: Most megacap tech leaders had already reported their numbers, but the sector still did most of the market’s heavy lifting last week—and the semiconductor space flexed the most muscle. Tech names were also prominently featured on Morgan Stanley & Co.’s recent report detailing stocks with the potential to deliver positive earnings surprises this month.1
The number: 6. Last week marked the SPX’s first six-week win streak since October 2024.
The scorecard: The Nasdaq 100 (NDX) tech index led the US market for the fourth week in a row—and took over first place for the year in the process:
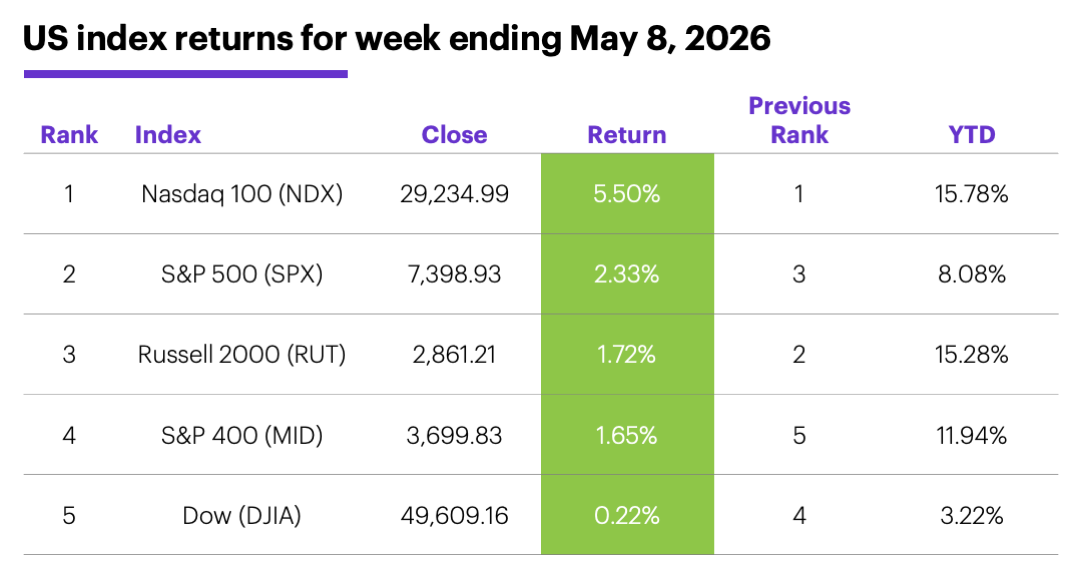
Source (data): Power E*TRADE. (For illustrative purposes. Not a recommendation.)
Sector returns: The strongest S&P 500 sectors last week were information technology (+7%), communication services (+1.8%), and consumer discretionary (+1.7%). The weakest sectors were energy (-5.4%), utilities (-4%), and financials (-1.4%).
S&P 500 stock movers: The biggest gains last week were Datadog (DDOG) +41% to $200.16, Akamai (AKAM) +41% to $147.71, Micron (MU) +36% to $746.81. The biggest losses were Zoetis (ZTS) -28% to $82.83, CDW (CDW) -23% to $104.79, Arista Networks (ANET) -18% to $141.77. Other movers: Agilon Health (AGL) +118% to $60.66 on Thursday, Innodata (INOD) +85% to $84.96 on Friday, Xanadu Quantum (XNDU) -61% to $13.99 on Monday, Primoris (PRIM) -50% to $101.23 on Wednesday.
Yields and the dollar: The 10-year US Treasury yield fell 0.01% to 4.37% last week. The US Dollar Index (DXY) fell 0.26 to 97.90.
Commodity futures: June WTI crude oil (CLM6) fell $6.52 to $95.42 last week. June gold (GCM6) rallied $86.20 to $4,730.70. Biggest gains: July cocoa (CCN6) +16.3%, July rice (ZRN6) +8.2%. Biggest declines: June WTI crude oil (CLM6) -6.4%, July Brent crude oil (BN6) -6.4%.
Crypto: After hitting its highest high since January 31 last Wednesday, Bitcoin pulled back—but still ended the week up 2.6% at $80,186.77. Ethereum climbed 0.5% to $2,306.97.
Coming this week
This week features inflation data, retail sales, and the meeting between President Trump and Chinese President Xi Jinping:
●Monday: Existing Home Sales
●Tuesday: NFIB Business Optimism Index, Consumer Price Index (CPI)
●Wednesday: Producer Price Index (PPI)
●Thursday: Retail Sales, Import Price Index, Business Inventories, Trump-Jinping meeting
●Friday: Empire State Manufacturing Index, Industrial Production and Capacity Utilization, Homebuilder Confidence Index, Trump-Jinping meeting
This week’s earnings include:
●Monday: AST SpaceMobile (ASTS), Barrick Mining (B), Anheuser Busch InBev (BUD), Dillard's (DDS), Hims & Hers Health (HIMS), Monday.com (MNDY), Simon Property Group (SPG), Steris (STE)
●Tuesday: First Majestic Silver (AG), Cisco (CSCO), Karooooo (KARO), Oklo (OKLO)
●Wednesday: Alibaba (BABA), Doximity Inc (DOCS), Dynatrace (DT), Wix.com (WIX)
●Thursday: Canadian Solar (CSIQ), Klarna (KLAR), Yeti (YETI)
●Friday: Sony (SONY)
Six-week streaks
Before last week, the SPX had only 48 other six-week-or-longer win streaks (following a down week) since 1957. Of those, 40 also coincided with the index setting its highest weekly close in at least 26 weeks. (Only one topped the 16.17% return the SPX posted over the most recent six weeks.)
The following chart shows the SPX’s performance in the first two weeks after the 40 six-week streaks that were also 26-week highs. The median return the first week after the streak (green) was a little larger than the benchmark one-week return (dark blue), the second week’s was smaller (light blue):
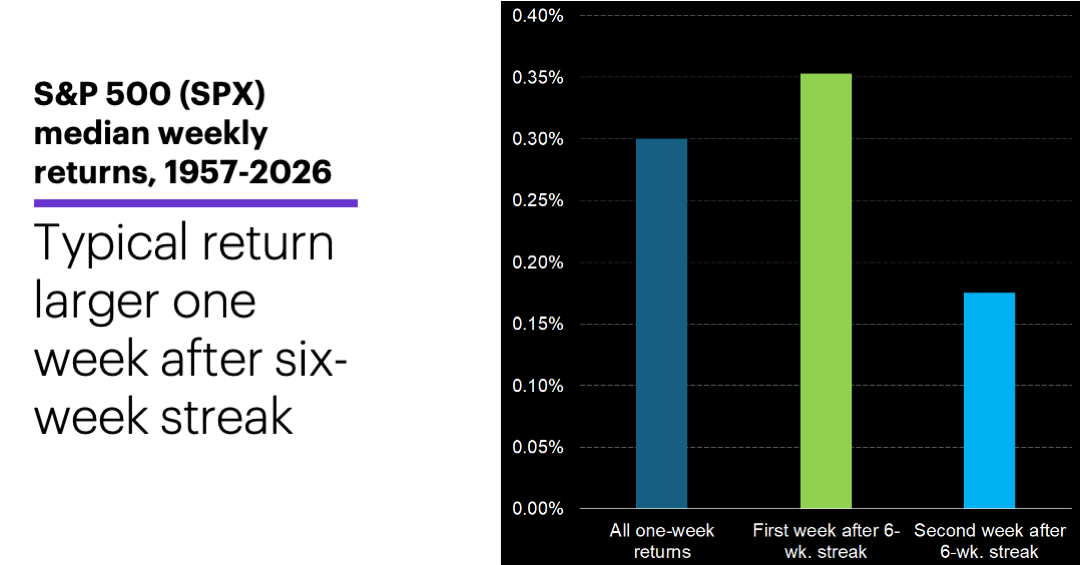
Source (data): EIA.gov and Power E*TRADE Pro. (For illustrative purposes. Not a recommendation. Note: It is not possible to invest directly in an index.)
The first week after the streak also tended to be an up week more often than average. While 56.4% of all weeks since 1957 have been positive, 67.5% were positive after the six-week streaks. Like the second week, the third and fourth weeks after the six-week streaks (not pictured) tended to have below-par returns.
While the nature of earnings, economic data, and geopolitical developments will dictate whether this week reflects the tendency shown in the chart, the data suggests that six up weeks in row hasn’t, in and of itself, necessarily signaled imminent reversal more than continuation.
Click here to log on to your account or learn more about E*TRADE's trading platforms, or follow the Company on X (Twitter), @ETRADE, for useful trading and investing insights.
1 MorganStanley.com. Quant Driven Earnings Ideas—Stocks Poised for Earnings Surprises in May 2026. May 6, 2026. 4/30/26.
2 All figures reflect S&P 500 (SPX) monthly closing prices, 19xx-2026. Supporting document available upon request.