Brand-name price action
- CL up post earnings in up-and-down trade
- Stock’s March sell-off was biggest since 2008
- Analysts cite company’s pricing power, positioning
So far, earnings season has rightly revolved around the tech sector, which led the US market’s charge back to record highs in April.
But it’s worth remembering there’s a world outside tech, and the stock’s that inhabit it play important roles in the economy—and, potentially, in trading and investing portfolios.
For example, consumer goods mainstay Colgate-Palmolive (CL) released its numbers on May 1, gaining 2.2% but also closing toward the bottom of the day’s range. This stock has since appeared somewhat “indecisive,” chopping higher and lower while remaining above its pre-earnings close:
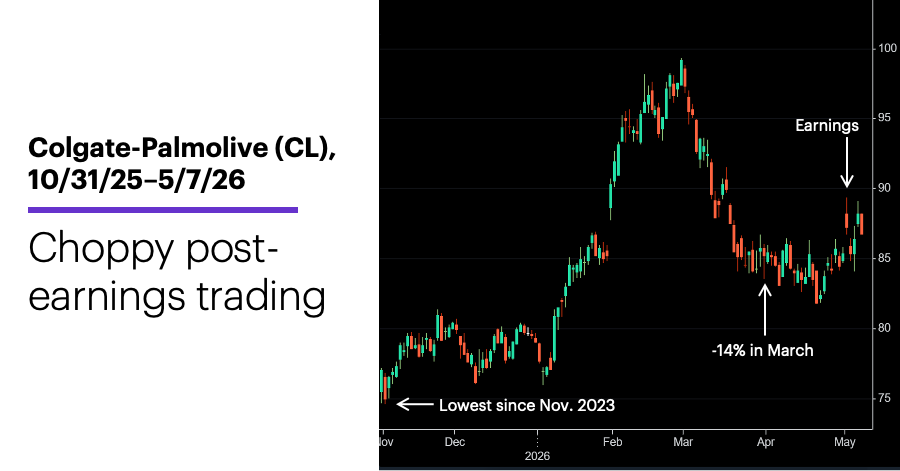
Source: Power E*TRADE. (For illustrative purposes. Not a recommendation.)
In the wake of the earnings announcement, Morgan Stanley & Co. analysts gave CL an Overweight rating, describing it as “well positioned” given its solid pricing power (especially relative to its peers in the household goods space) and greater exposure to higher-growth emerging markets.1 In an environment still struggling with the potential inflationary impact of high oil prices, pricing power is a critical attribute, especially for “defensive” stocks like CL.
In addition to the its recent short-term volatility, the stock coming off several months of turbulence that saw it to a two-year low in November, rally to a nearly 12-month high in February, then retreat 14% in March—its biggest down month since 2008, and one of just a handful of double-digit monthly percentage declines over the past four decades. The stock edged slightly lower in April before bouncing to end the month slightly higher.
The following chart shows CL’s one-month, three-month, six-month, and 12-month median net returns after 23 other times the stock followed a 5%-or-larger monthly loss with a month that made a lower low but closed higher (the March-April pattern). The chart compares these returns (green columns) to the median returns for all one-, three-, six-, and 12-month periods since 1985 (blue columns):
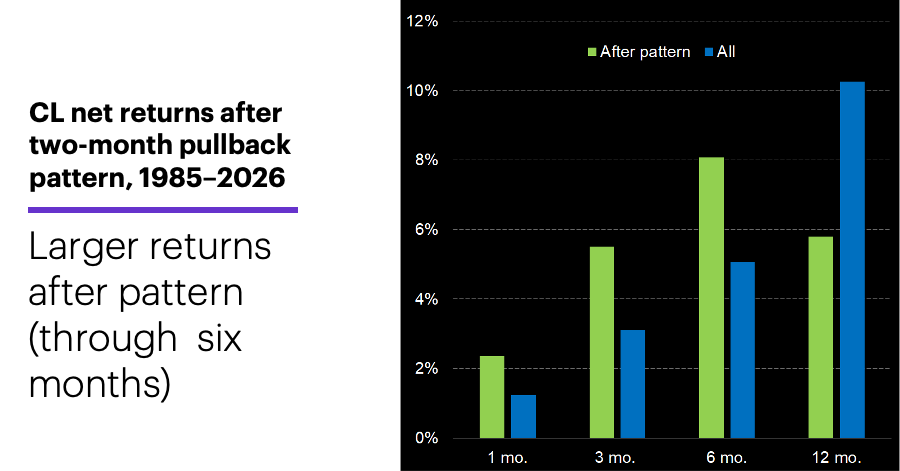
Source (data): Power E*TRADE. (For illustrative purposes. Not a recommendation.)
Based on this chart, CL’s rally so far this month is in line with its historical tendencies. After the two-month pattern, the stock outperformed its historical benchmark moves at the one-, three-, and six-month marks, but underperformed after 12-months.
Today’s numbers include (all times ET): Employment Report (8:30 a.m.), consumer sentiment (10 a.m.).
Today’s earnings include: PPL (PPL)
Click here to log on to your account or learn more about E*TRADE's trading platforms, or follow the Company on Twitter, @ETRADE, for useful trading and investing insights.
1 MorganStanley.com. 1Q Follow-Up: OW as OSG Inflection Becomes More Visible, EPS Pain From Commodities Manageable. 5/3/26.
2 All figures reflect CL monthly closing prices, 1985-20-26. Supporting document available upon request.