Market bounces, geopolitical swirl continues
- Stocks post weekly gain, but pause on renewed oil surge
- Oil tops $111 but energy stocks decline, tech jumps, yields dip
- This week: inflation data, GDP, durable goods
April started by delivering some market flowers to rebound-starved bulls, but gave way to brief showers at the end of the holiday-shortened week as sentiment swung between optimism and uncertainty about the Iran war.
The S&P 500’s (SPX) 3.7% Tuesday-Wednesday rally—fueled by hopes that an end to the Iran war was in sight—was its biggest two-day jump in nearly 10 months. But the SPX opened 1.5% lower on Thursday after President Trump announced there would be at least two to three more weeks of military action—then rebounded to close a little above breakeven for the day:
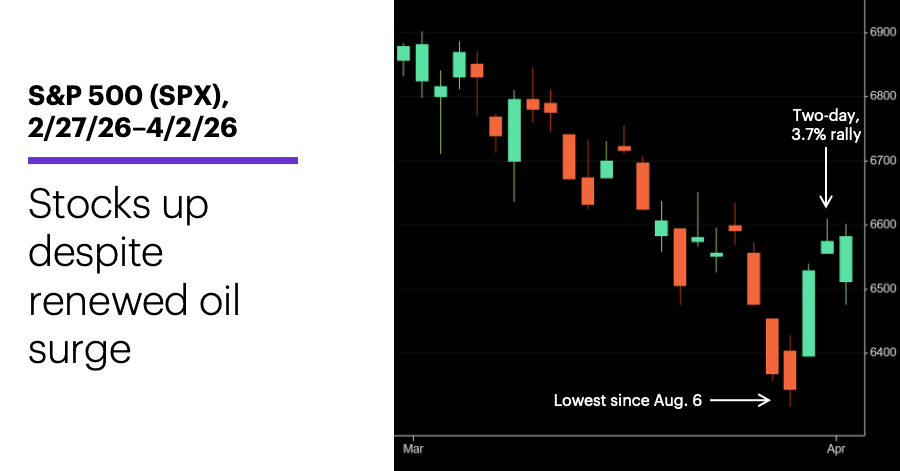
Source: Power E*TRADE. (For illustrative purposes. Not a recommendation. Note: It is not possible to invest in an index.)
The headline: Stocks snap five-week losing streak.
The fine print: In a departure from the market’s recent dynamic, the SPX’s Thursday gain occurred even though crude oil prices extended their record-setting rally—May WTI crude oil futures (CLJ6) jumped more than 15% intraday and closed up 11.4% at $111.54. It was the first time oil topped $110 since June 2022. Persistently high oil prices will likely keep inflation concerns on the front burner.
The move: -5.3%, the decline in the S&P 500 energy sector last week—despite the jump in oil prices.
The number: 178,000, the number of new jobs created in March. Overall, Friday’s jobs report contradicted the signs of labor-market softness shown in the job listings and job cuts data that preceded it last week.
The scorecard: Tech and large caps led the rally last week. The Nasdaq 100 (NDX) tech index’s gain was its biggest since November:
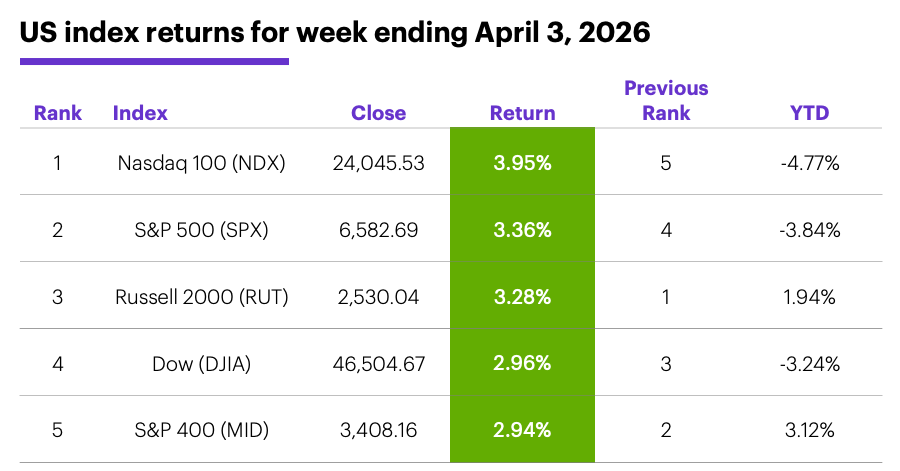
Source (data): Power E*TRADE. (For illustrative purposes. Not a recommendation.)
Sector returns: The strongest S&P 500 sectors last week were communication services (+6.4%), tech (+4.6%), and real estate (+3.8%). The weakest sectors were energy (-5.3%), consumer staples (+0.7%), and utilities (+1.6%).
Yields and the dollar: The 10-year US Treasury yield fell 0.09% to 4.34% last week. The US Dollar Index (DXY) slipped 0.03 to 100.12.
Commodity futures: May WTI crude oil (CLK6) jumped $11.90 to $111.54 last week. June gold (GCM6) closed Thursday at $4,679.70, up $155.40 for the week.
Crypto: Bitcoin rallied 2% to $67,290.52 last week, Ethereum climbed 4.2% to $2,065.35. Both have been stuck in relatively narrow trading ranges since hitting eight-month lows in early February.
Coming this week
This week’s economic calendar is heavy on inflation data, including the Consumer Price Index (CPI) and PCE Price Index:
●Monday: ISM Services Index
●Tuesday: Durable Goods Orders, New York Fed Consumer Inflation Expectations
●Wednesday: FOMC minutes
●Thursday: PCE Price Index, Personal Income and Spending, GDP (delayed)
●Friday: Consumer Price Index (CPI), consumer sentiment, factory orders
This week light earnings calendar is the prelude to the start of Q1 reporting season. Morgan Stanley & Co. recently published research highlighting stocks poised for earnings surprises in April. This week’s announcements include:
●Monday: Aehr Test Systems (AEHR)
●Tuesday: Levi Strauss (LEVI)
●Wednesday: Applied Digital (APLD), Delta Air Lines (DAL), PriceSmart (PSMT), RPM International (RPM), Constellation Brands (STZ)
●Thursday: Blackrock (BLK), WD-40 (WDFC)
Oil surge lessons
Although they are far from perfect parallels, comparing the recent oil surge to the one that occurred when Russia invaded Ukraine in February 2022 may provide some useful reminders about potential market behavior.2
The blue line in the following chart shows the path spot crude oil prices followed in 2022 from 10 trading days before the Russian invasion to 84 trading days after it. The red line shows how oil has moved this year, again measured from 10 trading days before the US and Israel initially launched airstrikes on Iran. The vertical dashed line marks the beginning of the respective military operations:
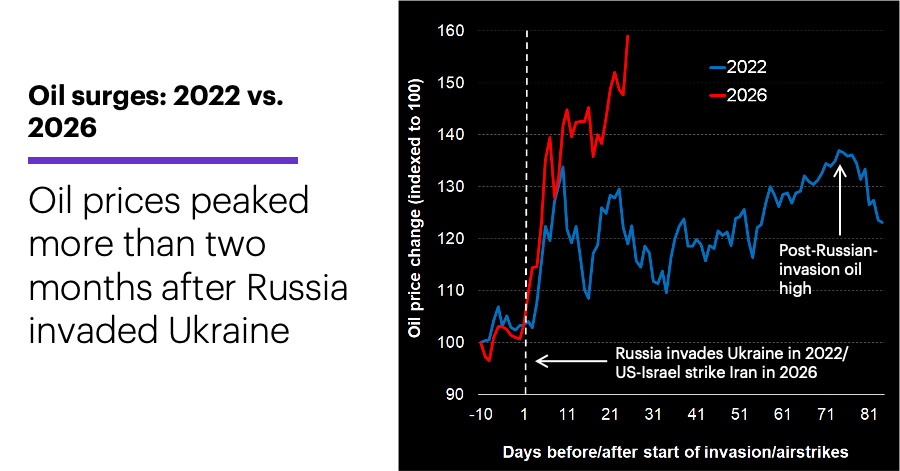
Source (data): U.S. Energy Information Administration (www.eia.gov)
For the first 20 trading days or so—that is, from 10 days before the commencement of military operations to 10 days after—oil followed a remarkably similar path in both cases, rising moderately in the runup to armed conflict and soaring after it started. In 2022, however, oil pulled back sharply from that point, swinging higher and lower over the next couple of months, and ultimately hitting its post-invasion high around 75 trading days later. As of Friday, oil was still pressing higher 25 trading days after the initial US-Israeli strikes on Iran.
On March 24, Morgan Stanley & Co. strategists made the case that the disruption in energy markets had moved “beyond logistics to production,” implying higher energy prices even in the event of a de-escalation of hostilities. They saw the $80-90 range as a 2026 price point for global Brent crude oil prices in a de-escalation scenario, while continued constraints would likely drive oil prices near $100-110 for at least two to three months.3
A possible takeaway from 2022 is that even in a de-escalation scenario, it could take a while for uncertainty about the current conflict to subside, and oil prices could remain elevated for an extended period, even if the market temporarily pulls back the way it did four years ago.
Click here to log on to your account or learn more about E*TRADE's trading platforms, or follow the Company on X (Twitter), @ETRADE, for useful trading and investing insights.
1 MorganStanley.com. Quant Driven Earnings Ideas—Stocks Poised for Earnings Surprises in April 2026. 4/3/26.
2 All figures reflect spot crude oil daily prices, 2022-2026. “Beginning of military operations” refers to 1) February 24, 2022 (when Russia invaded Ukraine) and 2) March 2, 2026 (the first trading day after the initial US-Israeli strikes on Iran, respectively. Supporting document available upon request.
3 MorganStanley.com. Energy Shocks in the Economy & Markets II. 3/24/26.