Quiet end to lively 2025
E*TRADE from Morgan Stanley
2025 was a year of contrasts for US markets. It was positive year for stocks, but the S&P 500 (SPX) significantly underperformed international equity markets.
In a year shaped by tariff, tech, and geopolitical headlines, the US market disregarded many seasonal tendencies. The SPX staged a record-setting rally off its April tariff sell-off lows—which included its best September-October return of the past 10 years—but it also ended the year with its third-smallest November-December return of the past decade.
Tech volatility became a major storyline in the latter part of the year amid conjecture about a potential AI bubble, but it was still 2025’s second-strongest SPX sector. The strongest? Communication services, thanks to its heavy concentration of megacap AI leaders.
Tech continued to be a story in December, although it wasn’t necessarily the final word on market performance. The SPX fell to a three-week low around mid-month as Oracle’s (ORCL) loss of data center financing renewed concerns about the viability of the AI trade. But despite being down nearly 2% for the month on December 17, the S&P 500 rebounded to hit new highs by the end of the year, although it ended the month slightly in the red:
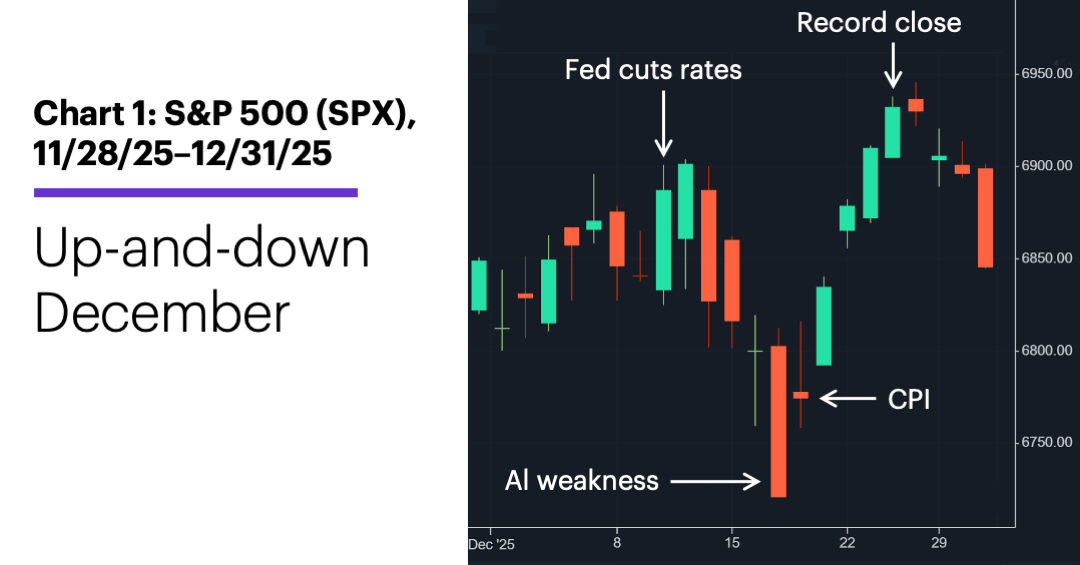
Source: Power E*TRADE. (For illustrative purposes. Not a recommendation. It is not possible to invest directly in an index.)
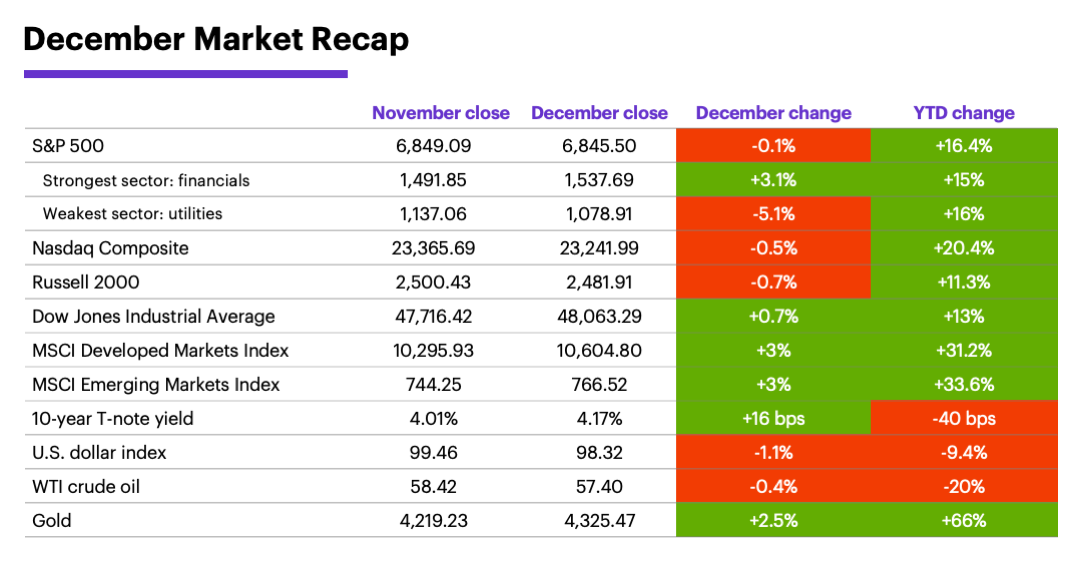
Tech didn’t lead the market—or lag it—last month. The financial sector paced the S&P 500 in December, followed by materials. Metals & mining was the strongest industry group in December (+10%) and for the year (+77%).
Metals were much more than a commodity story. Gold, silver, platinum, and copper all outgained stocks by a wide margin last year, and last month’s performance put exclamation points on their moves. Their surges helped the materials sector—specifically, metals & mining—drive the S&P 500 to fresh record highs during Christmas week. But volatility in metals in the final days of the month also tripped up the same stocks, weighing on the broad market.
US stocks underperformed global markets. The MSCI developed and emerging-markets indexes both posted strong gains in December, rounding out a year of significant outperformance vs. the US market.
Data source: Power E*TRADE and FactSet. (For illustrative purposes. Not a recommendation. It is not possible to invest directly in an index.) Note: crude oil, gold, and U.S. Dollar Index data reflect spot-market prices. BPS (basis point) = 0.01%. MSCI Index of Developed Markets and MSCI Emerging Markets Index represent “total-return” performance (index change including dividend reinvestment). Past performance is not indicative of future results.
Last month’s delayed economic data may have generated as many questions as answers. While the numbers suggested inflation was warm but not hot, and the jobs market was cooling but not frozen, there were concerns about how complete or accurate some of the data were. For example, Morgan Stanley & Co. economists argued the Consumer Price Index’s (CPI) downside inflation surprise resulted from unique calculation differences and holiday effects, among other factors. They also believe upcoming readings could surprise to the upside.1
Although the markets are expecting the Fed to remain on hold in January, interest rates are likely headed lower. The question, as Morgan Stanley & Co. economists note, is when and by how much? They explain their baseline outlook for January and April rate cuts depends on the December employment report (due on January 9). If unemployment rises, they think the Fed will cut. If not, this year’s reductions may come later—only after it becomes clear that inflation pressures are receding.2
How companies are adjusting to tariffs has implications for jobs market and inflation. According to Morgan Stanley & Co. strategists, companies raised their “output prices” as non-labor costs rose because of tariffs. Their survey data suggests that firms plan to increase prices further in 2026. If they’re successful, the strategists believe inflation will remain elevated, but layoffs should be avoided.3
Flows into US equities are poised to remain robust in 2026, supported by a mix of fiscal policy, Fed cuts, and deregulation.
Insight of the month: US relative strength in 2026. Morgan Stanley & Co. strategists noted in December that US ETF and mutual fund inflows—which dropped off after the early-April tariff announcement—had rebounded sharply in recent months. They expect flows into US equities to remain robust this year, supported by a “pro-cyclical mix of fiscal policy, Fed cuts, and deregulation.” The potential result: US stock-market outperformance vs. the rest of the world.4
Traditional stock-bond correlation poised to make a comeback? As Morgan Stanley & Co. analysts point out, a year without surprises would itself be a surprise. One of 10 possible market surprises on their radar this year is the potential for US stocks and bonds, which both rallied in 2025, to return to their traditional negative correlation.5
January market history. January has been a positive month for the S&P 500 in 59% of all years since 1957, with an above-average median return of 1.5%. The past couple of decades have been much weaker: January was a down month as often as it was up, and it actually had a negative average return because of several large losses (2008-2010, 2014-2016 and 2022).6
Key January dates: ISM Services Index, JOLTS, and factory orders (1/7), Employment Report (1/9), housing starts (1/9), CPI (1/13), PPI (1/14), retail sales (1/14 or 1/15), MLK day, US markets closed (1/19), housing starts (1/21), GDP (1/22), Fed interest rate decision (1/28), PCE Price Index (1/30).
1 MorganStanley.com. Oct/Nov CPI: Downward bias now, but payback ahead. 12/23/25.
2 MorganStanley.com. Fed speak: The policy rate should head lower. The question is when and by how much. 12/22/25.
3 MorganStanley.com. What's going on, part 2? Firms are pushing price to recover tariff costs. 12/23/25.
4 MorganStanley.com. 2025 Year-End Wrap-Up: Top of the Charts! 12/17/25.
5 MorganStanley.com. Top 10 Surprises for 2026. 12/19/25.
6 Figures reflect S&P 500 (SPX) monthly closing prices, 1957–2024. Supporting document available upon request.
Because of their narrow focus, sector investments tend to be more volatile than investments that diversify across many sectors and companies. Technology stocks may be especially volatile. Risks applicable to companies in the energy and natural resources sectors include commodity pricing risk, supply and demand risk, depletion risk and exploration risk. Health care sector stocks are subject to government regulation, as well as government approval of products and services, which can significantly impact price and availability, and which can also be significantly affected by rapid obsolescence and patent expirations.
Yields are subject to change with economic conditions. Yield is only one factor that should be considered when making an investment decision.