Market rides tech swings
- S&P 500 posts small weekly gain as tech churns
- Market reacts cautiously to jobs, inflation data
- This week: GDP, durable goods, Christmas holiday
The stock market sang a familiar tune last week, struggling to establish a trend as tech-sector sentiment ebbed and flowed. At the same time, the week’s seemingly Fed-friendly economic data appeared to do little to change the market’s cautious outlook on future rate cuts.
The S&P 500 (SPX) closed at a three-week low last Wednesday as Oracle (ORCL) sold off amid reports of canceled data center financing, renewing debate about the health of the AI trade. But the market bounced back on Thursday as an earnings beat from chipmaker Micron (MU) appeared to shift sentiment in the opposite direction, and a tech-led follow-through rally on Friday left the SPX slightly higher for the week:
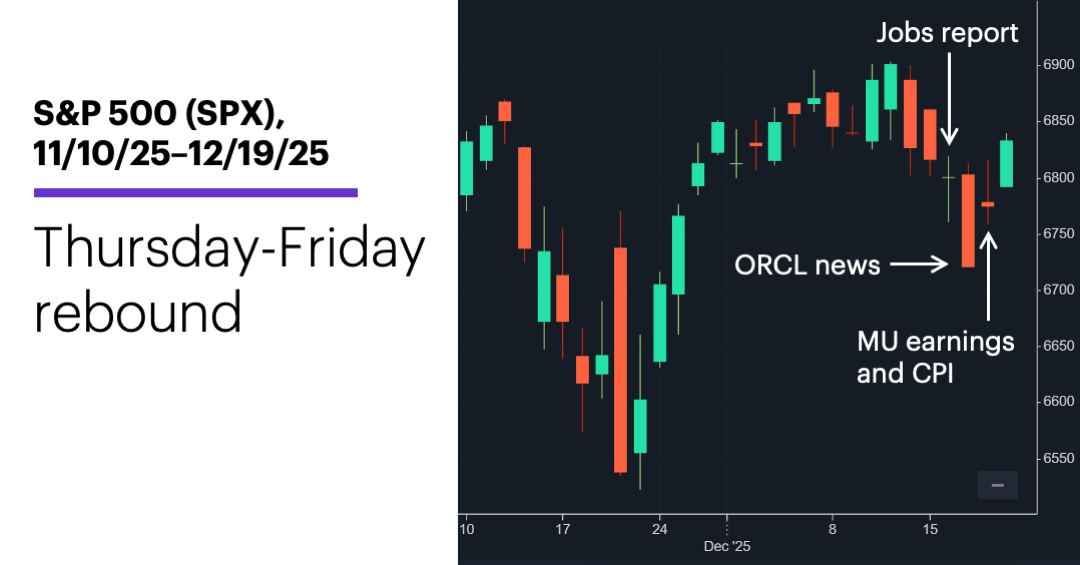
Source: Power E*TRADE. (For illustrative purposes. Not a recommendation. Note: It is not possible to invest in an index.)
The headline: Market still searching for a trend.
The fine print: Last week’s “softish” jobs report and cool inflation data—a potential recipe for additional Fed rate cuts—turned out to be a wash for the stock market. The SPX fell after Tuesday’s jobs report, but closed well off its intraday low. It closed higher after Thursday’s downside surprise from the Consumer Price Index (CPI), but ended the day well below its intraday high. Meanwhile, the odds of a January rate slipped last week from roughly 24% to around 22%.1
The move: While much of blame for last week’s tech volatility was laid at ORCL’s doorstep, the stock rallied 6.6% on Friday to close higher for the week.
The scorecard: Although the Nasdaq 100 (NDX) tech index was the week’s worst performer as of last Wednesday, by Friday it had jumped to first place:
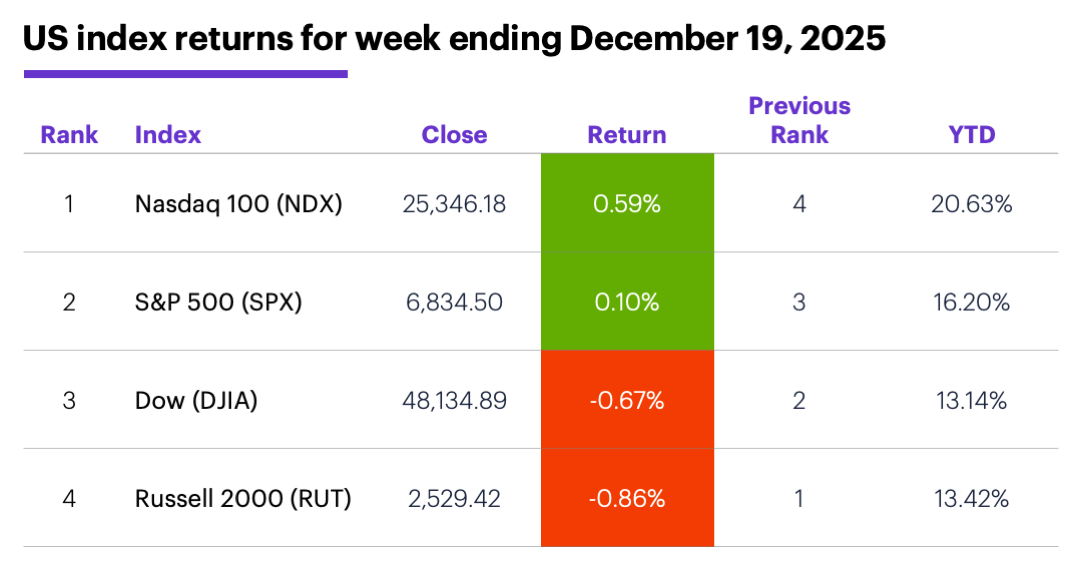
Source (data): Power E*TRADE. (For illustrative purposes. Not a recommendation.)
Sector returns: The strongest S&P 500 sectors last week were consumer discretionary (+1%), materials (+0.6%), and health care (+0.5%). The weakest sectors were energy (+-3%), real estate (+-1.4%), and consumer staples (+-0.9%).
Stock moves: Immunome (IMNM) +16% to $22.64 on Monday (then -16% to $19.78 on Wednesday), Tilray (TLRY) +28% to $13.94 on Tuesday. Inspire Medical Systems (INSP) -19% to $95.27 and Insmed (INSM) -16% to $166.55, both on Thursday.
Yields and the dollar: The 10-year US Treasury yield fell 0.04% to 4.15% last week. The US Dollar Index (DXY) climbed 0.20 to 98.60.
Futures: February gold (GCG6) flirted with its October record highs last week, rallying $59 to $4,387.30. February WTI crude oil (CLG6) fell 3% to a contract low of $55.07 last Wednesday, ending the week down $0.72 at $56.52. Biggest rallies: January Lithium (LTHF6) +18.6%, March palladium (PAH6) +15.8%. Biggest declines: March cocoa (CCH6) -6.9%, March natural gas (NGH6) -5.6%.
Coming this week
The shortened holiday week has a light economic calendar, but a delayed GDP is the highlight of the one “busy” day:
●Monday: Chicago Fed National Activity Index
●Tuesday: GDP, Durable Goods Orders, consumer confidence
●Wednesday: Early close (US stock exchanges close at 1 p.m. ET.
●Thursday: Markets closed for Christmas
This week’s earnings include:
●Monday: Ennis (EBF)
●Tuesday: Limoneira (LMNR)
Check the Active Trader Commentary each morning for an updated list of earnings announcements, IPOs, economic reports, and other market events.
Santa behind schedule?
Although stocks are down this month—and St. Nick also put coal in the market’s stocking last December—history generally supports the idea of a “Santa Claus rally.”
While the “why” is a matter of conjecture (positive feelings during the holiday season, end-of-year “window dressing” on the Street, etc.), the following chart clearly shows the “what”—a tendency for stronger net performance in the latter portion of December:
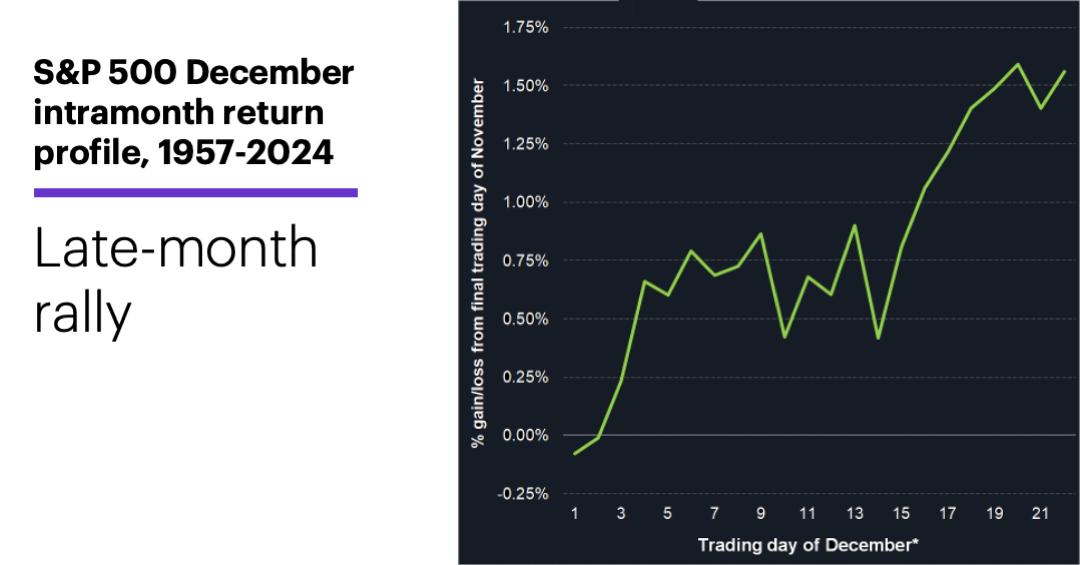
Source (data): Power E*TRADE. (For illustrative purposes. Not a recommendation. Note: It is not possible to invest in an index.)
This composite picture of the SPX’s intra-December performance over the past 68 years (reflecting the median return from the last day of November to each trading day of December) shows mid-month choppiness generally giving way to bullishness. The final six to eight trading days of the month—from day 15 forward—accounted for a significant portion of December’s historical gains. (Last Friday was the 15th trading day of this month.)
Simplifying the picture by splitting the month in half reveals that the SPX’s median net return for the first 11 trading days of December was 0.7%, while the median net return for the final 11 trading days was 1%. The first half of the month was positive in 42 years since 1957 (62% of the time), while the second half was positive in 52 years (76% of the time).2
However, the SPX fell 2.5% or more in the second half of December three times in recent years—2018, 2022, and last year.
Click here to log on to your account or learn more about E*TRADE's trading platforms, or follow the Company on X (Twitter), @ETRADE, for useful trading and investing insights.
1 CMEGroup.com. FedWatch Tool. 12/19/24.
2 All figures reflect S&P 500 (SPX) daily closing prices, 1957–2024. The December “intramonth return” refers to the SPX’s cumulative percentage change, measured from the final trading day of November to each of the next 22 trading days. (Note: Depending on the year, the 22nd trading day of December may represent the first trading day of January rather than the final trading day of December.) Supporting document available upon request.