Tech stumbles, rally cools
- Stocks mixed as tech pulls back, bond yields jump
- Inflation data hot, oil spends most of week above $100
- This week: NVDA earnings, retail earnings, Fed minutes
Last week may have highlighted the good and bad of a market driven primarily by one sector. A little loss of momentum can have a significant ripple effect.
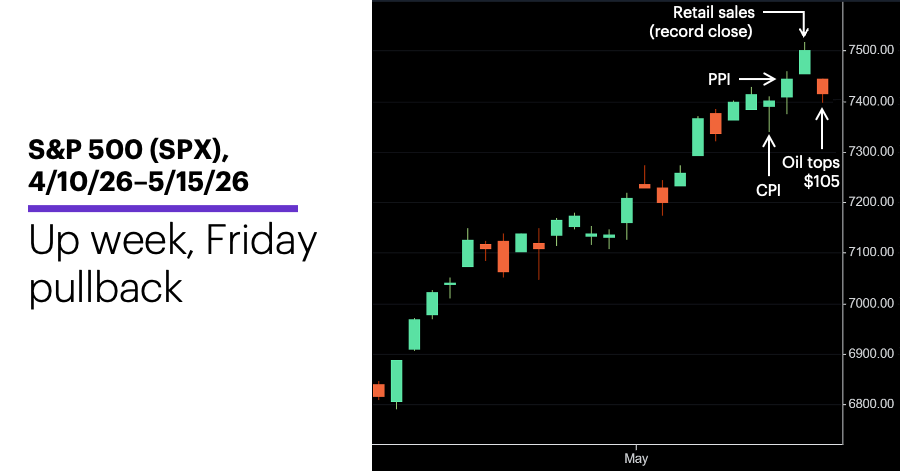
When the closing bell rang last Thursday, the US stock market appeared to be on cruise control: The S&P 500 (SPX) was up 1.4% for the week despite hotter-than-expected inflation data, US oil prices above $100, and a retail sales report that wasn’t necessarily as strong as it first appeared to be.
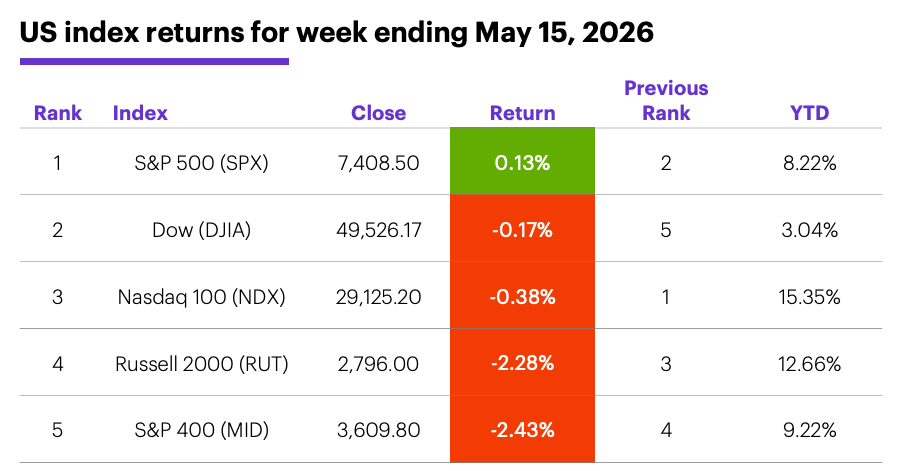
But as tech (and materials) sold off on Friday—and oil futures pushed above $105—the SPX's seventh-straight "up" week turned out to be a marginal gain, and the other major indexes posted losses for the week:
Source: Power E*TRADE. (For illustrative purposes. Not a recommendation. Note: It is not possible to invest in an index.)
The headline: Tech gives, and tech takes away.
The fine print: Notably, last week stocks appeared to ignore (at least until Friday) another oil surge and Consumer Price Index (CPI) and Producer Price Index (PPI) readings that showed inflation increased more than expected last month. Also, while last Thursday’s retail sales report met expectations, Ellen Zentner, Chief Economic Strategist for Morgan Stanley Wealth Management, noted that sales actually declined in April (along with real wages) when adjusted for inflation.
The number: 329, the number of S&P 500 stocks that fell last week. Even before Friday’s downturn, the majority of the SPX was in the red for the week, with the index propped up by a handful of tech names.
The move: The 10-year US Treasury yield jumped 0.22% last week, closing Friday at 4.59%—its highest level since May 21, 2025.
The scorecard: The Russell 2000 (RUT) small-cap index and the S&P 400 (MID) mid-cap index fell the most last week:
Source (data): Power E*TRADE. (For illustrative purposes. Not a recommendation.)
Sectors: The strongest S&P 500 sectors last week were energy (+6.5%), information technology (+1.3%), and consumer staples (+1.2%). The weakest sectors were consumer discretionary (-3.1%), real estate (-2.5%), and materials (-2.3%).
S&P 500 stock movers: The biggest gains last week were Cisco (CSCO) +22% to $118.21 and Palo Alto Networks (PANW) +17% to $242.83. The biggest losses were Intel (INTC) -13% to $108.77 and Carvana (CVNA) -13% to $67.17. Other moves: Everspin Technologies (MRAM) +47% to $39.92 on Monday, Velo3D (VELO) +49% to $21.01 on Wednesday, Power Solutions (PSIX) -19% to $62.45 on Monday (and -39% to $38 on Tuesday).
US dollar: The US Dollar Index (DXY) tracked higher with Treasury yields, climbing 1.38 to 99.28—its highest close in more than a month.
Commodity futures: June WTI crude oil (CLM6) jumped $10 to $105.42 last week—its highest weekly close since the start of the Iran conflict. A 2.6% Friday sell-off left June gold (GCM6) down $168.80 for the week at $4,561.90. Biggest gains: July WTI crude oil (CLN6) +10.1%, July Brent crude oil (BN6) +7.9%. Biggest declines: July orange juice (OJN6) -10.2%, July cotton (CTN6) -4.9%.
Crypto: Bitcoin fell 1.4% to $79,065.78 last week. Ethereum dropped 3.6% to $2,223.33—its lowest close in more than a month.
Coming this week
The retail portion of earnings season kicks off this week, although NVIDIA’s numbers will likely be a focal point for many traders:
●Monday: Agilysys (AGYS), James Hardie Industries (JHX), ViaSat (VSAT), XP (XP)
●Tuesday: American Superconductor (AMSC), Dycom (DY), Eagle Materials (EXP), Home Depot (HD), Keysight (KEYS), Toll Brothers (TOL), Urban Outfitters (URBN)
●Wednesday: Analog Devices (ADI), Copart (CPRT), E.L.F. Beauty (ELF), Hasbro (HAS), Intuit (INTU), Lowe's (LOW), NVIDIA (NVDA), Ross Stores (ROST), Target (TGT), TJX (TJX), Williams Sonoma (WSM)
●Thursday: Advance Auto Parts (AAP), Deere & Co. (DE), Ralph Lauren (RL), Workday (WDAY), Walmart (WMT), Zoom Communications (ZM)
●Friday: Booz Allen Hamilton (BAH)
This week’s numbers include:
●Monday: NAHB Housing Market Index
●Tuesday: Pending Home Sales
●Wednesday: FOMC minutes
●Thursday: Housing Starts and Building Permits, Philly Fed Manufacturing Survey, S&P Global Manufacturing and Services PMIs (flash)
●Friday: Consumer Sentiment, Leading Economic Indicators Index
Checking in with the VIX
As the SPX’s rebound off its March low became one of its strongest short-term rallies of recent decades, this space highlighted historical evidence of the market’s tendency to extend such moves in the near term.
Last week delivered a slightly different message, courtesy of the Cboe Volatility Index (VIX). While the VIX typically falls when the SPX rallies (and vice versa), Friday marked the second week in a row that the SPX and the VIX both closed higher—suggesting the so-called “fear index” was signaling potentially higher market volatility even though the SPX was climbing.
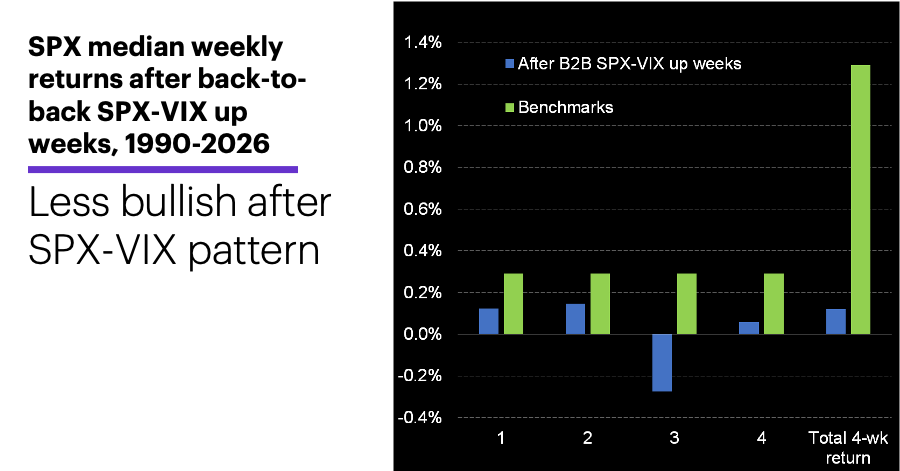
The SPX and VIX have closed higher in back-to-back weeks when the SPX also closed the second week at a 52-week (or longer) high 31 other times since 1990. The following chart shows the SPX’s median returns for each of the next four weeks after these episodes, along with its four-week net return. For context, the chart compares these returns to the SPX’s median returns for all one- and four-week periods during this period (0.29% and 1.21%, respectively):1
Source (data): EIA.gov and Power E*TRADE Pro. (For illustrative purposes. Not a recommendation. Note: It is not possible to invest directly in an index.)
While the SPX’s median return after back-to-back SPX-VIX up weeks was negative only for week three, it was smaller than its benchmark return for all four weeks, and its 0.12% median four-week return was one-tenth of the benchmark—although they individual returns ranged from +7.7% to -6.6%. Four weeks after back-to-back SPX-VIX up weeks, the SPX was higher 16 times and lower 15 times.
Click here to log on to your account or learn more about E*TRADE's trading platforms, or follow the Company on X (Twitter), @ETRADE, for useful trading and investing insights.
1 All figures reflect S&P 500 (SPX) and Cboe Volatility Index weekly closing prices, 1990-2026. Supporting document available upon request.