Home on the (trading) range
- Stocks down, bonds up to end February
- Financials fall, tech chops, gold climbs
- This week: jobs report, Middle East
Stocks concluded an up-and-down February with an up-and-down week, as tech volatility and AI-disruption concerns left the market lower—modestly—for the week and the month.
The S&P 500 (SPX) stumbled out of the gate last Monday as IBM (IBM) and CrowdStrike (CRWD) were among the latest victims of the AI story, while the White House’s announcement of new tariffs also weighed on sentiment.
Despite a robust rebound over the next two days, the SPX lost momentum after NVIDIA’s (NVDA) earnings release. The market followed through to the downside on Friday as a hotter-than-expected Producer Price Index (PPI) provided another reminder that sticky inflation may delay Fed rate cuts. Over the weekend, news of US-Israeli strikes on Iran raised the prospect of a volatile start to March:
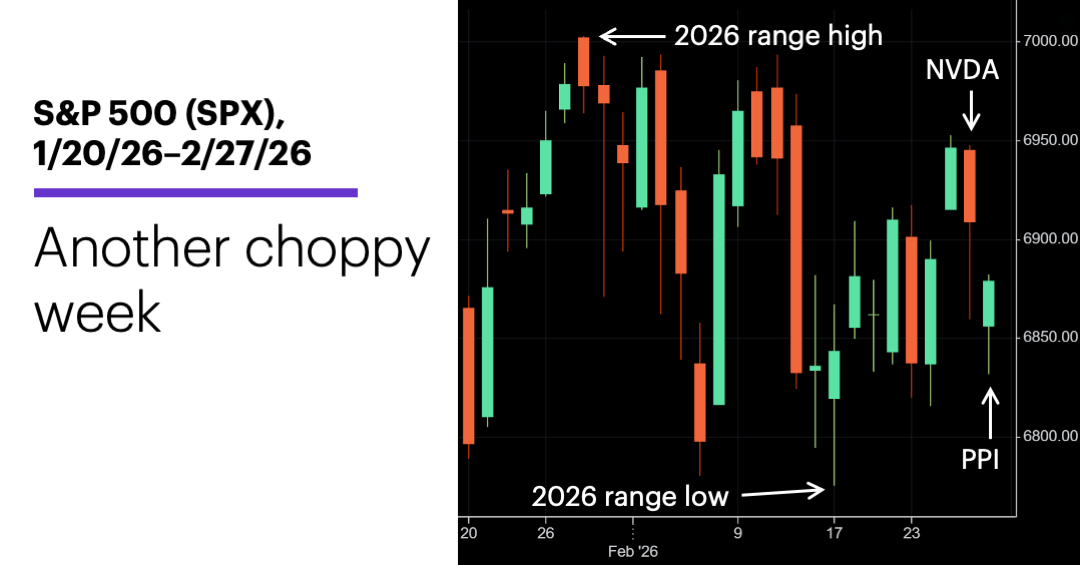
Source: Power E*TRADE. (For illustrative purposes. Not a recommendation. Note: It is not possible to invest in an index.)
The headline: S&P 500 ends week in middle of recent range.
The fine print: The AI sword likely has two edges. Morgan Stanley & Co. strategists believe “GenAI fundamentally expands the capabilities of enterprise software, presenting opportunities along with risks.”1 Overall, they see potential upside in the recent disruption, but recommend a “stock-specific” approach to identifying winners and losers (reflected in their stock screen).
The move: As of Friday, insurer Aon (AON) had rallied 8.1% since February 9, when it sold off because of AI disruption fears (see “Disruption vs. interruption”).
The scorecard: The Dow Jones Industrial Average (DJIA) lost the most ground last week:
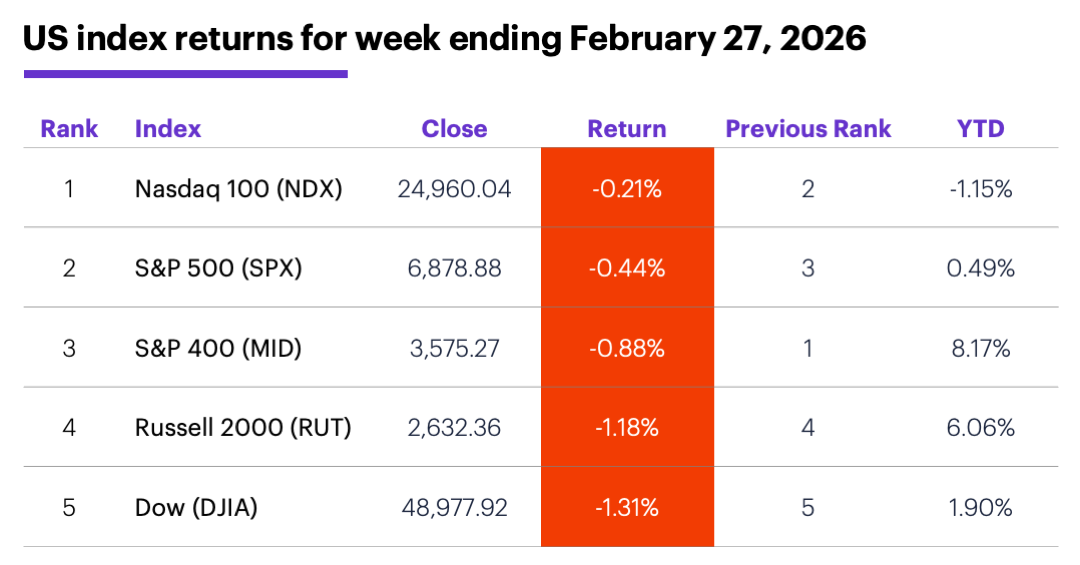
Source (data): Power E*TRADE. (For illustrative purposes. Not a recommendation.)
Sector returns: The strongest S&P 500 sectors last week were utilities (+2.9%), consumer staples (+2.5%), and energy (+2.3%). The weakest sectors were tech (-2.1%), financials (-2.1%), and consumer discretionary (-0.9%).
Stock moves: Arcellx (ACLX) +77% to $113.75 on Monday, Clear Secure (YOU) +39% to $46.51 on Wednesday. Oddity Tech (ODD) -49% to $14.74 on Wednesday, UniQure (QURE) -31% to $17.12 on Thursday.
Yields and the dollar: On Friday, the 10-year US Treasury closed below 4% for the first time since November 26, ending the week down 0.13% at 3.96%. The US Dollar Index (DXY) slipped 0.19 to 97.61.
Futures: April gold (GCJ6) ended last week with its highest close since January 29, up $167 to $5,247.90. April WTI crude oil (CLJ6) pulled back most of last week, but rallied Friday to end the week up $0.54 at $67.02 (before news of the strikes on Iran). Biggest gains: June Lithium (LTHM6) +27.1%, May silver (SIK6) +12.4%. Biggest losses: May cocoa (CCK6) -9.1%, April natural gas (NGJ6) -4.2%.
Coming this week
Labor market data dominates the economic calendar, but geopolitics will likely monopolize the market discussion, at least early in the week:
●Monday: S&P Global Manufacturing PMI, ISM Manufacturing Index
●Wednesday: ADP private employment report, S&P Global Services PMI, ISM Services Index, Fed Beige Book, vehicle sales
●Thursday: job cuts, import and export prices, Productivity and Labor Costs
●Friday: Employment Report, Retail Sales, Business and Retail Inventories, Consumer Credit
This week’s earnings calendar is again heavy on retail names, sprinkled with tech. A few highlights:
●Monday: Apogee Therapeutics (APGE), AST SpaceMobile (ASTS), AeroVironment (AVAV), MongoDB (MDB), LendingTree (TREE)
●Tuesday: AutoZone (AZO), Best Buy (BBY), Box (BOX), Campbell's (CPB), CrowdStrike (CRWD), Ross Stores (ROST), Target (TGT), Thor Industries (THO)
●Wednesday: Abercrombie & Fitch (ANF), Broadcom (AVGO), Burlington Stores (BURL), Cracker Barrel (CBRL), Dycom (DY), Macy's (M), Wix.com (WIX)
●Thursday: Autohome (ATHM), Costco (COST), Gap (GAP), Kroger (KR), Marvell Technology (MRVL)
Market Mover Update: Most of GlobalFoundries’ (GFS) heavy call options volume last Thursday turned out to be traders getting out of positions. The open interest (OI) in all but two of the most actively traded contracts was lower on Friday. The exceptions: the April $45 and $55 calls, which had steady and slightly higher OI, respectively (see “Chips on or off the table?”).
March-ing on
Over the long-term, March has been a middle-of-the-road month for the SPX—well above average from 1957-1990, and slightly below average since. Overall, in the 69 years since 1957 March has been a positive month 45 times (65%):2
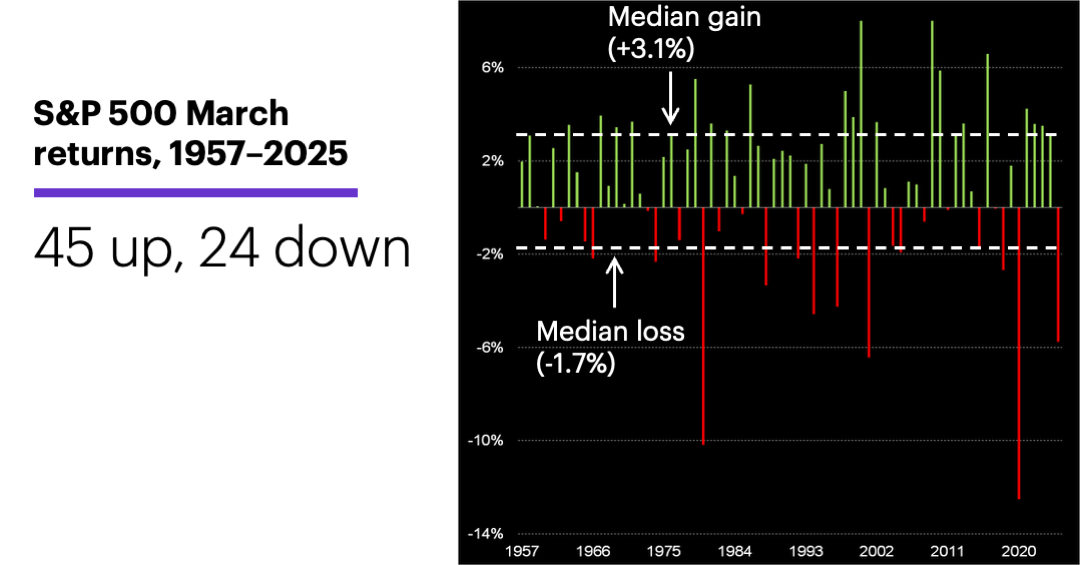
Source: Power E*TRADE Pro. (For illustrative purposes. Not a recommendation. Note: It is not possible to invest directly in an index.)
Over the past 35 years, March has been a positive month in 22 years (63%, fifth highest), with a median return of 1.1% (seventh highest).
More recent years have included some exceptionally large declines (in 2020 and 2025), but also four years in a row (2021-2024) when the SPX gained more than 3% in March.
Click here to log on to your account or learn more about E*TRADE's trading platforms, or follow the Company on X (Twitter), @ETRADE, for useful trading and investing insights.
1 MorganStanley.com. AI Disruption Debate: Our Analysts Weigh In. 2/25/26.
2 All figures reflect S&P 500 (SPX) monthly closing prices, 1957-2025. Supporting document available upon request.