Stocks climb amid evolving tariff story
- SCOTUS rules on tariffs, stocks snap two-week dip
- GDP cool, inflation warm, oil jumps on geopolitics
- This week: retail earnings, home prices, NVDA
The US stock market may be coming off yet another week of rangebound trading, but this one ended with a bang.
Stocks appeared to be in danger of posting their third-straight down week early last Friday after a soft Q4 GDP reading and a hotter-than-expected PCE Price Index appeared to sour investor sentiment in pre-market trading. But roughly 30 minutes into the regular trading session, the S&P 500 (SPX) jumped after the Supreme Court’s ruling that some of President Trump’s tariffs were illegal:
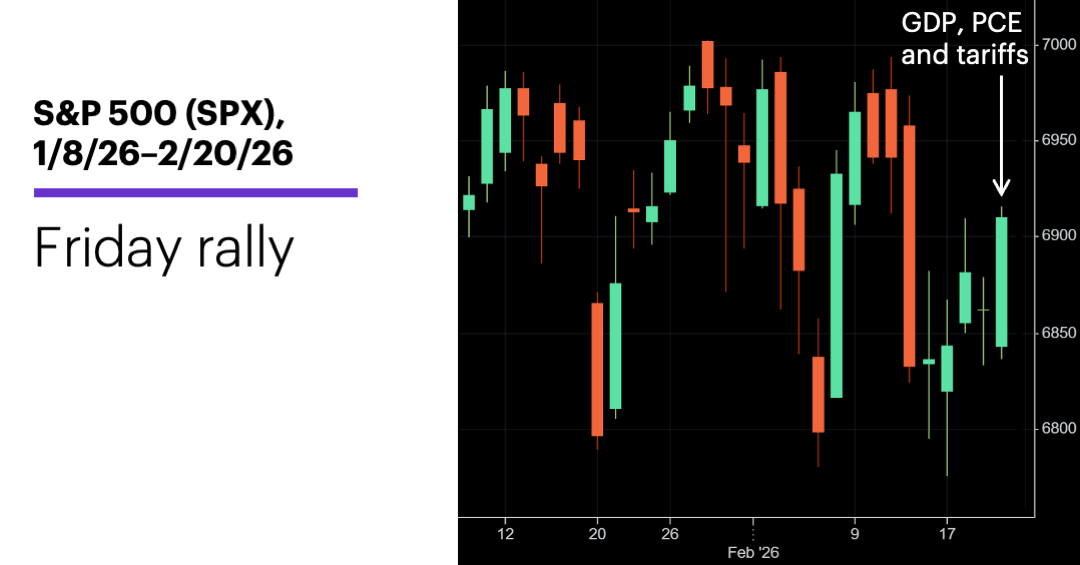
Source: Power E*TRADE. (For illustrative purposes. Not a recommendation. Note: It is not possible to invest in an index.)
The headline: Stocks snap two-week pullback as tariffs return to center stage.
The fine print: The Supreme Court’s decision didn’t signal the end of the tariff story, it signaled new chapters are about to be written. While the ruling struck down levies implemented using the International Emergency Economic Powers Act (IEEPA), it left others intact, and the White House quickly announced new tariffs.
The number: 12, the number of weeks the SPX has traded in a roughly 4% high-low range between 6,720.43 and 7,002.28.
The scorecard: The S&P 400 (MID) mid-cap index led the market for the week:
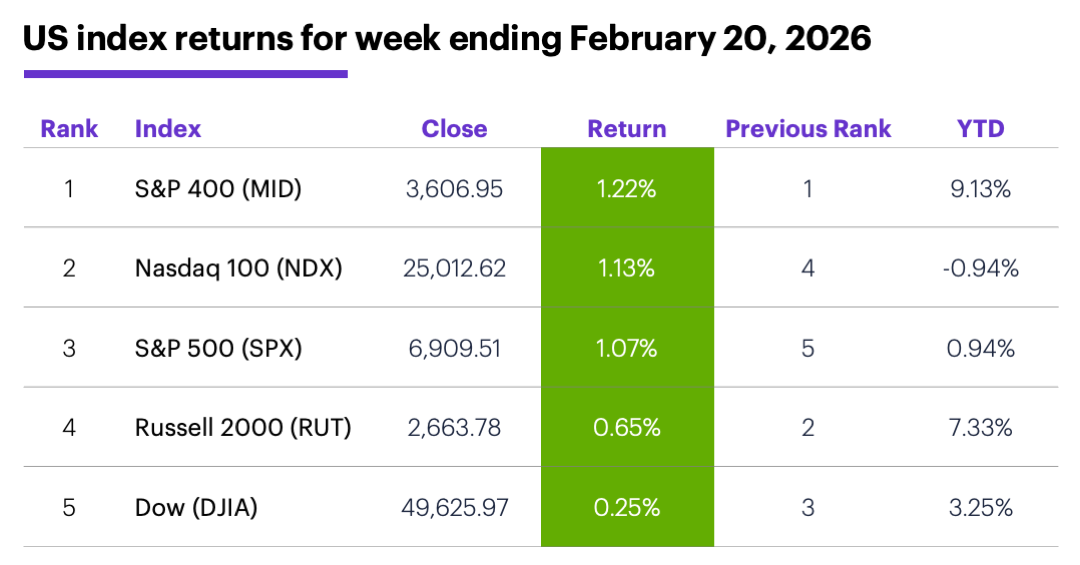
Source (data): Power E*TRADE. (For illustrative purposes. Not a recommendation.)
Sector returns: The strongest S&P 500 sectors last week were communication services (+2.3%), and consumer discretionary (+1.72%), and industrials (+1.69%). The weakest sectors were consumer staples (-2.3%), health care (-0.6%), and utilities (-0.5%).
Stock moves: Masimo (MASI) +34% to $174.69 on Tuesday, RingCentral (RNG) +34% to $39.50 on Friday. Net Lease Office Properties (NLOP) -35% to $13.07 on Wednesday, Grail (GRAL) -51% to $50.21 on Friday.
Yields and the dollar: The 10-year US Treasury yield climbed 0.03% to 4.08% last week. The US Dollar Index (DXY) rallied 0.89 to 97.80.
Futures: April gold (GCJ6) rose $34.60 to $5,080.90 last week, thanks mostly to a strong rally on Friday. April WTI crude oil (CLJ6) rallied $3.73 to $66.48 amid US-Iran tensions.
Coming this week
This week’s numbers include:
●Monday: Factory Orders
●Tuesday: S&P Case-Shiller Home Price Index, FHFA House Price Index, Consumer Confidence, Wholesale Inventories
●Friday: Producer Price Index (PPI), Chicago PMI, Construction Spending
Retail earnings dominate this week’s calendar, but several high-profile tech names are also reporting, inlcuding NVIDIA (NVDA). Some highlights:
●Monday: Bed Bath & Beyond (BBBY), Dillard's (DDS), Keysight (KEYS), Boston Beer Company (SAM), Ultra Clean (UCTT)
●Tuesday: Dycom (DY), eBay (EBAY), First Solar (FSLR), GoDaddy (GDDY), Home Depot (HD), HP (HPQ), Henry Schein (HSIC), Keurig Dr. Pepper (KDP), Navitas Semiconductor (NVTS), Repligen (RGEN), Urban Outfitters (URBN)
●Wednesday: Agilent (A), Disc Medicine (IRON), Lowe's (LOW), NVIDIA (NVDA, Pure Storage (PSTG), Snowflake (SNOW), TJX (TJX), Zoom Communications (ZM)
●Thursday: Compass (COMP), CoreWeave (CRWV), Dell (DELL), Hormel Foods (HRL), Intuit (INTU), KBR (KBR), MP Materials (MP), Sunrun (RUN), J.M. Smucker (SJM), NuScale Power (SMR), Block (XYZ), Zscaler (ZS)
●Friday: Delek US (DK)
Market Mover Update: Most of GlobalFoundries’ (GFS) heavy call options volume last Thursday turned out to be traders getting out of positions. The open interest (OI) in all but two of the most actively traded contracts was lower on Friday. The exceptions: the April $45 and $55 calls, which had steady and slightly higher OI, respectively (see “Chips on or off the table?”).
A stagnant four months
Since 1957, November through February has been one of the strongest four-month stretches for US stocks. The SPX’s 4.8% median net return for this period is second only to its 5% median gain from October through January.1
While the November-February return has ranged from +21.5% to -24.1%, the 2025-2026 iteration is shaping up to be relatively flat. For example, if February had ended last Friday, the SPX’s November-February return would have been 1%. Of course, a lot can happen in five days, but if market doesn’t do much this week, it could be only the seventh time since 1957 that the SPX’s November-February return was between +2% and -2%, and just the 15th time it was between +3% and -3%.
Admittedly, that’s not much evidence to go on, but middle-of-the-road November-February returns (positive or negative) have sometimes been followed by more tepid returns. For example, when the SPX’s return for this period was between +3% and -3%, its median March return was 0.4%. By contrast, when the November-February return was more than +3% or less than -3%, its median March return was +1.7%.
1 All figures reflect S&P 500 (SPX) monthly closing prices, 1957-2025. Supporting document available upon request.
Click here to log on to your account or learn more about E*TRADE's trading platforms, or follow the Company on X (Twitter), @ETRADE, for useful trading and investing insights.
1 MorganStanley.com. Thoughts on AI Disruption Fears Driving Sell-Off. 2/11/26.