Stocks slip as oil drives sentiment
- Stocks and bonds fall again as oil surge fuels volatility
- Tech shows more relative strength, financials soft
- This week: Fed rate decision, oil watch
The Middle East continued to dictate market action last week, as concerns about the potential for an extended conflict and surging oil prices weighed on stocks.
Last Monday oil futures prices retreated $35 from their intraday high of $119.40—and the S&P 500 (SPX) reversed a 1.5% intraday loss to close solidly higher on the day—after President Trump suggested the war with Iran was nearing its conclusion.
But the respite turned out to be short-lived, with Iran’s closure of the Strait of Hormuz—which handles roughly 20% of global oil shipments—reigniting speculation about higher-for-longer oil prices. Despite announcements of strategic oil reserve releases, prices jumped back to $95 on Thursday and edged above $98 on Friday, sending the SPX to fresh lows:
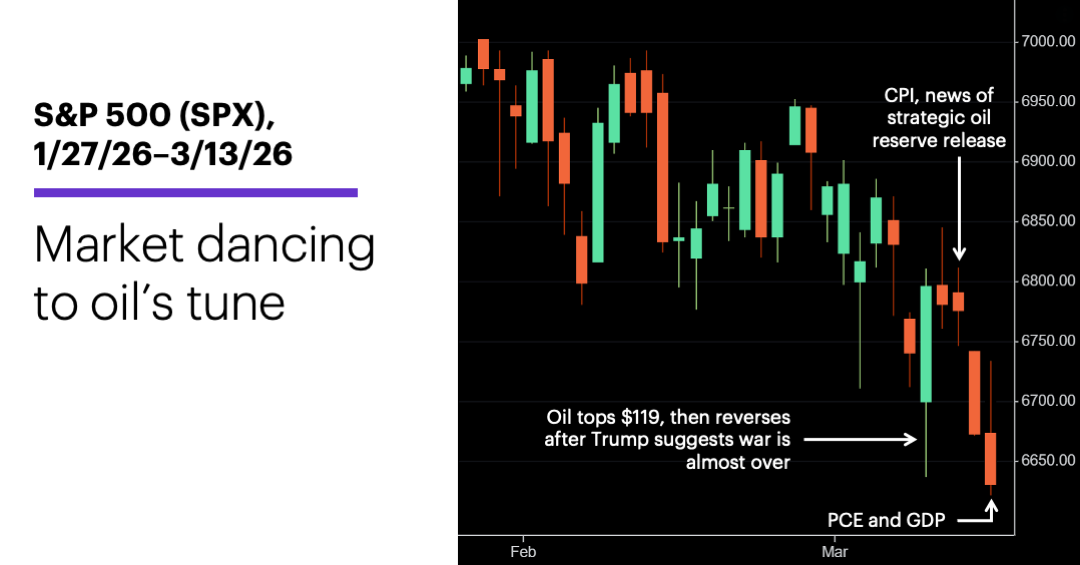
Source: Power E*TRADE. (For illustrative purposes. Not a recommendation. Note: It is not possible to invest in an index.)
The headline: As goes oil, so goes the stock market—in reverse.
The fine print: Despite the oil-driven market volatility, the SPX ended last week only around 5% below its all-time high close, and was still above the November lows that mark the lower boundary of its five-month trading range. US stocks have outperformed many international markets since the conflict began, in part reflecting US energy independence.
The numbers: Last Wednesday the Consumer Price Index (CPI) showed stickier-than-expected inflation in January, and Friday’s PCE Price Index confirmed it. Friday’s Q4 GDP revision halved the previous estimate of economic growth, from 1.4% to 0.7%.
The scorecard: The S&P 400 (MID) mid-cap index was the only major gauge to end last week up for the year. The Nasdaq 100 (NDX) tech index lost the least ground:
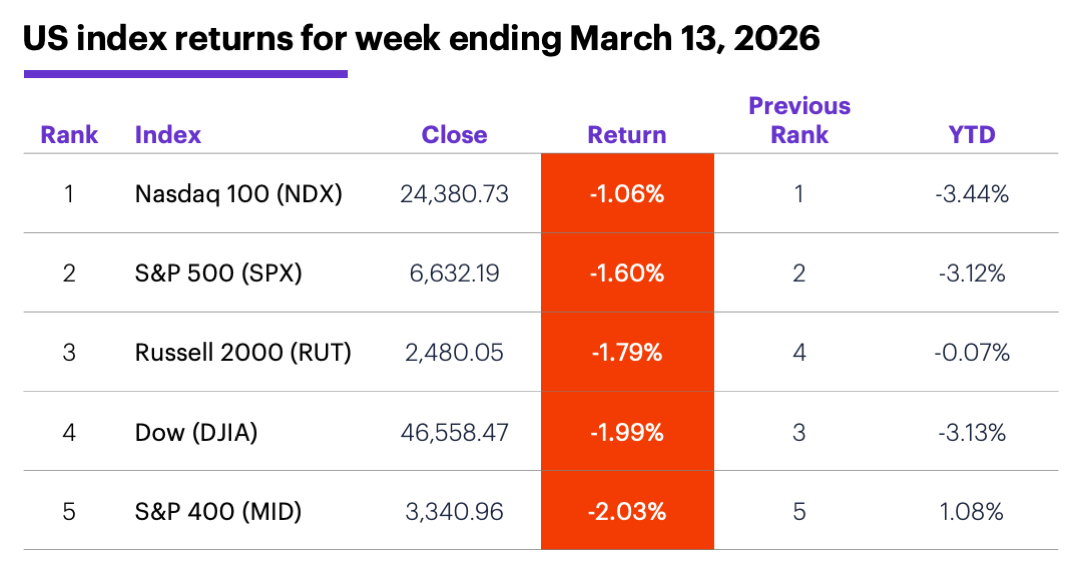
Source (data): Power E*TRADE. (For illustrative purposes. Not a recommendation.)
Sector returns: The strongest S&P 500 sectors last week were energy (+2.1%), utilities (+0.4%), and consumer staples (-0.3%). The weakest sectors were financials (-3.4%), industrials (-3.2%), and consumer discretionary (-3%).
Stock moves: Xenon Pharmaceuticals (XENE) +50% to $62.76 and Hims & Hers Health (HIMS) +41% to $22.16, both on Monday. Olema Pharmaceuticals (OLMA) -26% to $16 on Monday, BioNTech (BNTX) -18% to $83.89 on Tuesday.
Yields and the dollar: Bonds fell as longer-term yields climbed last week. The 10-year US Treasury yield rose 0.13% to 4.28%, ending the week at its highest level since January 20. The US Dollar Index (DXY) rallied 1.37 to 100.36—the first time it topped 100 since November 24.
Crypto: Bitcoin +5.8% to $71,256.71 for the week, Ethereum +6.8% to $2,104.87.
Commodities: Despite last Monday’s sharp pullback, April WTI crude oil (CLJ6) rallied $7.81 to $98.71—ending the week with its highest close of the recent surge. April gold (GCJ6) fell $97 to $5,061.70 in another bearish week for precious metals. Biggest gains: June Brent crude oil (BM6) +13.4%, May heating oil (HOK6) +12.8%, May RBOB gasoline (RBK6) +10.9%. Biggest declines: June palladium (PAM6) -5%, April platinum (PLJ6) -4.7%, May silver (SIK6).
Coming this week
The Fed is expected to leave interest rates unchanged on Wednesday, but Chair Powell’s second-to-last FOMC press conference—where he will no doubt be bombarded with questions about oil prices and inflation—will be must-see market TV:
●Monday: NY Empire State Manufacturing Index, Industrial Production and Capacity Utilization
●Tuesday: NAHB Housing Market Index, Pending Home Sales
●Wednesday: Producer Price Index (PPI), Factory Orders, Fed interest rate decision
●Thursday: Philadelphia Fed Manufacturing Survey, New Home Sales, Leading Economic Indicators Index
This week’s earnings include:
●Monday: Dollar Tree (DLTR), Inhibrx Biosciences (INBX), Science Applications (SAIC)
●Tuesday: Docusign (DOCU), Lululemon (LULU), Oklo (OKLO), Williams Sonoma (WSM)
●Wednesday: Designer Brands (DBI), Five Below (FIVE), General Mills (GIS), Jabil (JBL), Macy's (M), Micron (MU)
●Thursday: Accenture (ACN), Carnival (CCL), Darden Restaurants (DRI), FedEx (FDX)
●Friday: Ollie’s Bargain Outlet (OLLI)
VIX clicks
What happens when the stock market falls and options traders are less concerned than they were when the market was trading higher a few days earlier?
It doesn’t happen often, but it did on March 12 (last Thursday) when the SPX closed below its March 6 close, which at the time was the index’s lowest close of the past 12 weeks. Meanwhile, the Cboe Volatility Index (VIX) also closed lower on March 12 than it did on March 6:
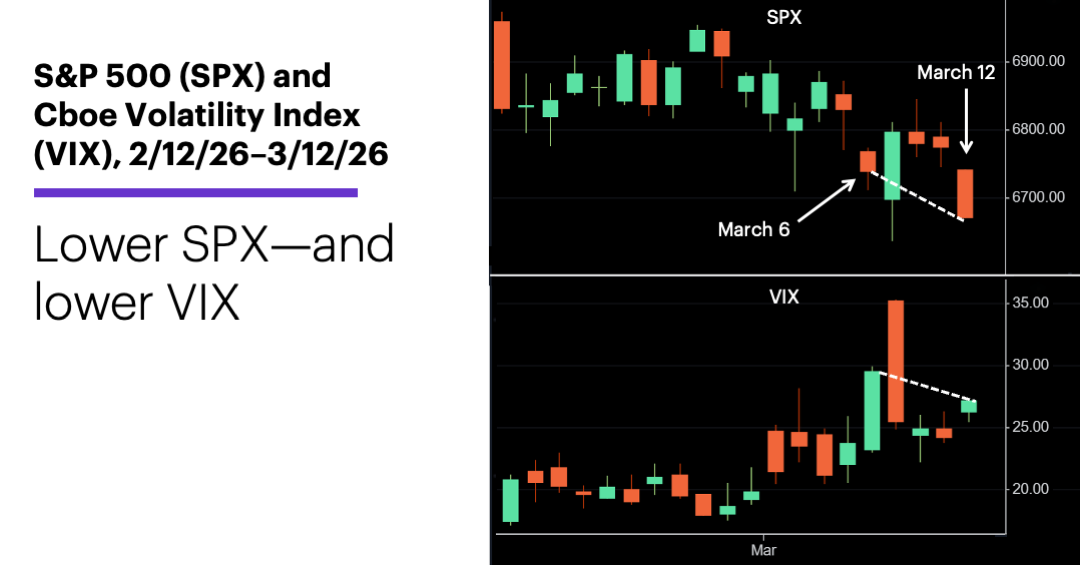
Source: Power E*TRADE Pro. (For illustrative purposes. Not a recommendation. Note: It is not possible to invest directly in an index.)
More often than not, the VIX rises as the SPX falls, reflecting increased expectations for future market volatility. For example, since 1990, when the SPX closed at its lowest level in at least four trading days, as it did last Thursday, the VIX closed higher than it did four days earlier 1,748 times vs. lower just 254 times.
What happened last Thursday was an even rarer event, given it was the SPX’s lowest close in roughly three months, while the VIX’s March 6 close was its highest in more than 10 months. Even a less extreme version of this pattern—the SPX closing at a 10-day (or longer) low, and the VIX following its highest close in at least 40 days with four closes below that close2—has happened only 16 other times over the past 37 years.
The following chart compares the percentage of times the SPX was higher five, 10, and 20 trading days after the pattern (blue bars) to how often it gained ground in all five-, 10-, and 20-trading-day periods (green columns):
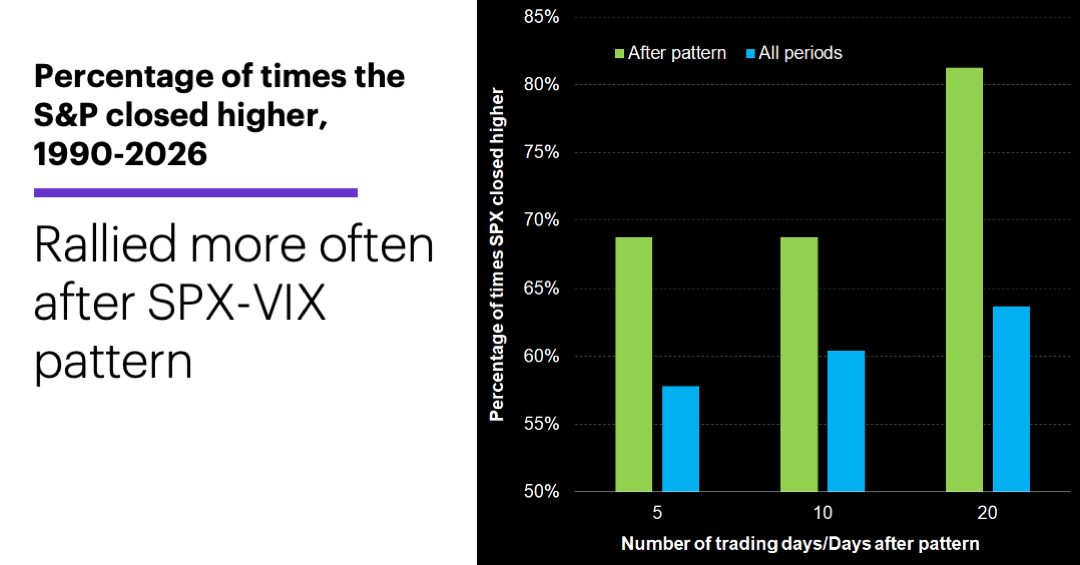
Source: Power E*TRADE Pro. (For illustrative purposes. Not a recommendation. Note: It is not possible to invest directly in an index.)
For example, while the SPX climbed in 58% of all five-day periods, it was higher 69% of the time (11 of 16 cases) five trading days after the pattern. Similarly, 64% of all 20-day periods had positive returns, but the SPX was higher 81% of the time (13 of 16 cases) 20 days after the pattern.
This simply shows what has happened other times the SPX-VIX relationship resembled last week’s. While the tendency for the market to rally more often than average after these events is clear, every situation is unique—and the current one is arguably "more unique" than most. Until the geopolitical landscape settles, oil prices are poised to have an outsized influence on the market’s short-term performance.
Final note: The VIX closed slightly lower last Friday than it did on Thursday—possibly reinforcing the picture of an options market that was experiencing less “stress” about future volatility, despite falling stock prices.
Click here to log on to your account or learn more about E*TRADE's trading platforms, or follow the Company on X (Twitter), @ETRADE, for useful trading and investing insights.
1 All figures reflect S&P 500 (SPX) and Cboe Volatility Index (VIX) closing prices, 1990-2026. The specific pattern consists of 1) an SPX close that is below the closes of at least the last 10 trading days, accompanied by 2) three consecutive VIX closes that are lower than the close four trading days earlier, when 3) the VIX close four days earlier was the highest VIX close in at least 42 trading days. Supporting document available upon request.