All market roads leading to oil
- Oil up nearly 6% Wednesday despite release of reserves
- Market up more than 30% this month, 54% for year
- Duration key to longer-term impact on stocks
It’s not much of an exaggeration to say that, right now, financial markets are revolving around energy—specifically, crude oil.
That dynamic was certaintly on full display on Wednesday, as the stock market appeared to take most of its intraday cues from swinging oil prices. Reports that the 32 countries in International Energy Agency (IEA) had agreed to release 400 million barrels of crude to combat supply disruptions were followed by crude oil prices dropping into negative territory for the day.1 The S&P 500 (SPX), which had opened the day slightly lower, rallied to a 0.4% intraday gain around 10 a.m. ET as April WTI crude oil futures (CLJ6) reached their intraday low of $82.66.
But the oil retreat turned out to be short lived. By noon, the futures had rebounded as high as $88.07—and the SPX had reversed to an 0.5% intraday loss. Many of the oil market’s ups and downs the remainder of the session were mirrored—in reverse—by the SPX.
If history is any guide, this hyper-correlation between oil prices and the stocks should ease when the geopolitical landscape has settled. Until then, spiking oil prices will likely continue to be a drag on the stock market (outside of the energy sector), while significant oil pullbacks could boost it.
The following price chart shows although on Wednesday oil prices were down significantly from the spike high near $120 they hit on Monday—a level not seen since July 2022, when the market was beginning to retreat from the highs it hit after Russia invaded Ukraine—they were still up nearly 30% for the month:
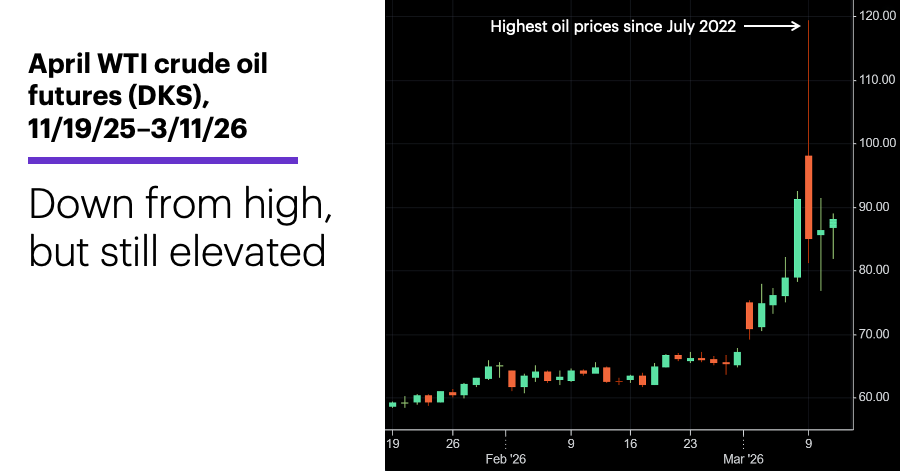
Source: Power E*TRADE. (For illustrative purposes. Not a recommendation.)
While Morgan Stanley Wealth Management strategists pointed out on Monday that over the past eight decades “war-induced oil shocks have not been kind to equities,” they also noted the current situation has some unique characteristics: The conflict began with excess global oil supply, and is occurring during a capex boom and potential manufacturing rebound. “These tailwinds, and anticipated stimulus, have kept stocks firmly bid, despite intense subsurface rotations.”2
Meanwhile, Morgan Stanley & Co. analysts maintained a constructive six- to 12-month outlook for stocks “as earnings growth reaccelerates and the broadening continues.” While they acknowledge the market isn’t “immune from further near-term volatility if oil prices continue to rise alongside a strengthening dollar,” they argue “further weakness in the near term sets up an opportunity to add to the cyclical trades we prefer over the intermediate term across Financials, Industrials, Consumer Discretionary and Small Caps.” They offer a more bearish outlook if oil prices remain above $100 for multiple months and the Fed doesn’t cut rates or add additional liquidity.3
Today’s numbers include (all times ET): Housing Starts and Building Permits (8:30 a.m.), International Trade in Goods and Services (8:30 a.m.), weekly jobless claims (8:30 a.m.), EIA Natural Gas Report (10:30 a.m.).
Today’s earnings include (all times ET): Adobe (ADBE), Buckle (BKE), Dollar General (DG), Dick's Sporting Goods (DKS), Ulta Beauty (ULTA).
Click here to log on to your account or learn more about E*TRADE's trading platforms, or follow the Company on Twitter, @ETRADE, for useful trading and investing insights.
1 CNBC. Crude prices are higher after IEA announces historic oil reserve release. 3/11/26.
2 MorganStanley.com. The GIC Weekly: War and Oil Shocks. 3/9/26.
3 MorganStanley.com. Weekly Warm-up: Focus on Pace of Oil and Dollar Moves. 3/9/26.