Prime time for earnings season
- NFLX up more than 34% since Feb. 12
- Rally interrupted a seven-month, 43% correction
- Shares hit five-month high on Thursday
Big banks traditionally kick off earnings season, but next week one stock will be attempting to snatch the spotlight from them—Netflix (NFLX), which is scheduled to release its numbers after the bell on April 16.
So far, it’s been a somewhat turbulent year for the streaming leader, which saw its shares hit a 15-month low on February 12 amid concerns about the company’s attempted—and ultimately unsuccessful—acquisition of Warner Bros. Discovery (WBD).
The stock’s trajectory since then may have some traders and investors wondering if NFLX lost a battle, but not necessarily a war. The company’s formal abandonment of the WBD deal on February 26 was followed by a 13.8% rally on February 27—the exclamation point on a 27% rally from two days before the announcement to five days after it. As of Thursday, the stock was up more than 34% from its early-February low:
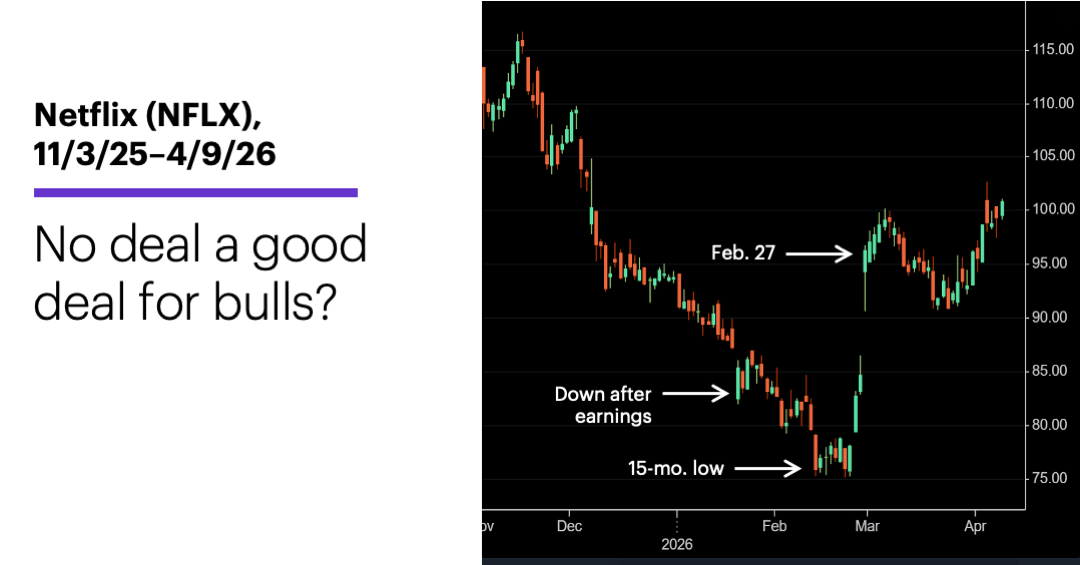
Source: Power E*TRADE. (For illustrative purposes. Not a recommendation.)
The sentiment reflected in that rebound was echoed in a recent report from Morgan Stanley & Co. analysts, who summarized NFLX—without Warner Bros.—as a “cleaner, higher-visibility, and lower-volatility business with more degrees of freedom and lower financial leverage.”1
Whether that translates into a well-received earnings report and a possible short-term momentum boost remains to be seen. Netflix’s past nine announcements have been followed by five earnings-day rallies and four declines:
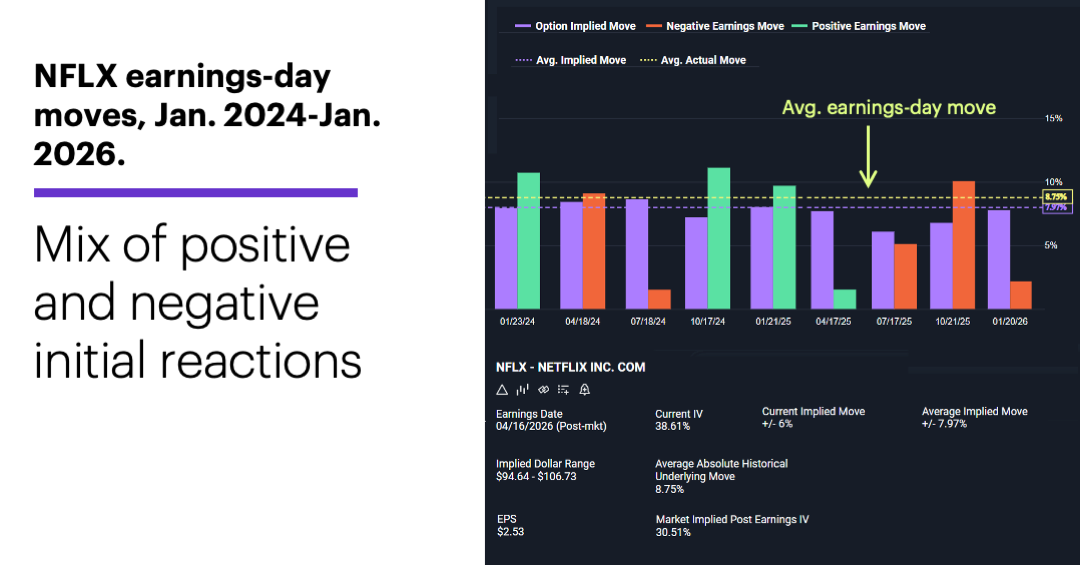
Source: Power E*TRADE. (For illustrative purposes. Not a recommendation.)
The purple columns show the estimated earnings-day move (based on options implied volatility), with the green or red columns representing the actual up or down moves, respectively, that occurred. (The company typically releases its numbers after the closing bell, so its “earnings-day” moves reflect performance the day after the announcements.)
Keeping in mind that implied volatility is an estimate of how much the options market expects the underlying stock to move, but not its direction, the purple dashed line shows NFLX’s average estimated earnings-day move (over the past three years) was 7.97%, while the yellow dashed line shows the actual average move was +/-8.75%. During the period covered in this chart, the moves ranged from +11.1% (October 2024) to -10.1% (October 2025). More often than not, the stock continued in same direction it closed (up or down) the day after the announcement over the next five to 10 trading days.
Market Mover Update: Open interest in Nutanix (NTNX) April $42.50 calls dropped from around 4,900 on Wednesday to 109 on Thursday, indicating Wednesday’s heavy volume was mostly a case of traders getting out of existing positions. That may have been a good idea for traders who were long those calls, since the contracts traded as low as $0.08 on Thursday as the stock fell more than 6%.
Today’s numbers include (all times ET): Consumer Price Index (8:30 a.m.), consumer sentiment (10 a.m.), factory orders (10 a.m.).
Click here to log on to your account or learn more about E*TRADE's trading platforms, or follow the Company on Twitter, @ETRADE, for useful trading and investing insights.
1 MorganStanley.com. Reclaiming The Crown – Reiterate OW. 4/9/26.