July crosscurrents leave stocks in range
E*TRADE from Morgan Stanley
Stable-to-lower inflation and strong earnings may normally be a recipe for a rising stock market, but in July these tailwinds came up against renewed US-Iran hostilities, resurgent oil prices, sell-offs in AI infrastructure stocks, and questions about Fed policy.
The result was a slight decline for the S&P 500 (SPX)—which, despite signs of significant rotation below the surface, remained confined to what is now a nearly two-month trading range.
Following its historical intramonth trading profile quite closely, July enjoyed a solid first half of the month before giving back its gains in the second half as oil rallied and the chip sell-off accelerated. Although a rally in the final two days of July nearly lifted the S&P 500 (SPX) back to breakeven for the month, the index posted back-to-back monthly losses for just the second time in the past 15 months:
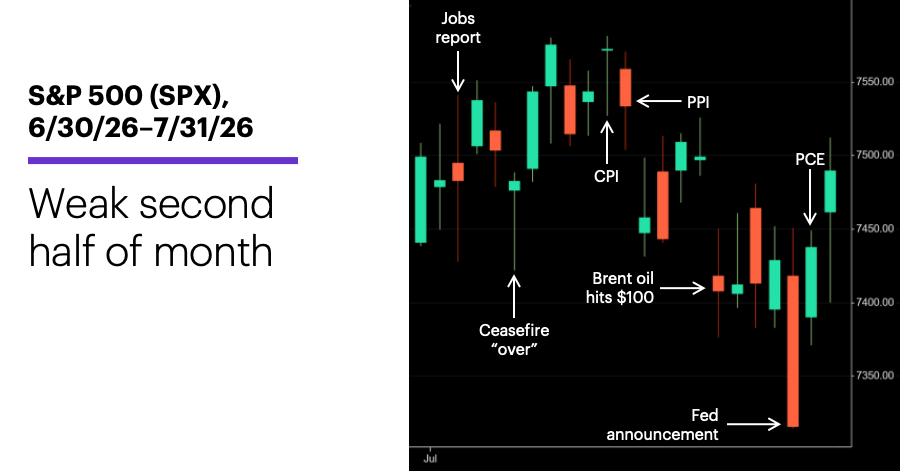
Source: Power E*TRADE. (For illustrative purposes. Not a recommendation. It is not possible to invest directly in an index.)
Semiconductors were at the center of the tech volatility story. Sharp sell-offs in many of the names that had formerly led the group to record levels (especially memory stocks) pushed the PHLX Semiconductor Index (SOX) into a bear market. The chip gauge fell as much as 28.6% from its June record high before bouncing in the final days of the month.
But chips weren’t the weakest link in the tech chain. Within the SPX, the electronic equipment industry group fell nearly 10 percentage points more than the semiconductor group (-11.6% vs. -21.2%, respectively).
Oil volatility soared as geopolitical uncertainty returned as a market catalyst. After falling more than 20% to a four-month low in June, US crude oil prices surged again last month after the US-Iran ceasefire broke down, climbing as much a $21 before ending the month more than $15 higher.
Energy led the S&P 500 last month, while consumer discretionary was the weakest sector. Seven of the SPX’s 11 sectors were positive for the month. Year to date, energy is the strongest sector, while consumer discretionary is the weakest.
Yields climbed and the curve steepened. The benchmark 10-year US Treasury yield ended July at its highest level since mid-January 2025. Morgan Stanley Wealth Management strategists note that rising real rates could imply that investors need to “recalibrate expectations for policy reaction function and valuations.”1
Emerging markets took the biggest step back last month. Globally, the S&P 500 underperformed developed markets, but fell much less than the MSCI Emerging Markets Index.
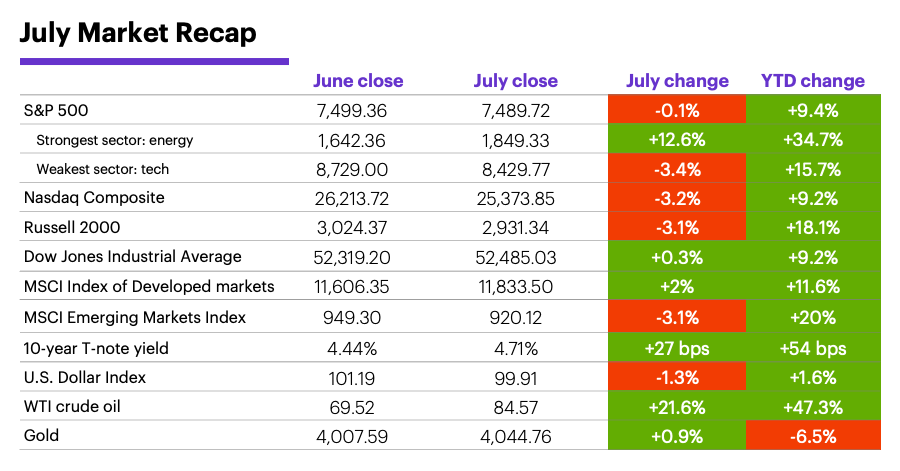
Data source: Power E*TRADE and FactSet. (For illustrative purposes. Not a recommendation. It is not possible to invest directly in an index.) Note: crude oil, gold, and U.S. Dollar Index data reflect spot-market prices. BPS (basis point) = 0.01%. MSCI Index of Developed Markets and MSCI Emerging Markets Index represent “total-return” performance (index change including dividend reinvestment). Past performance is not indicative of future results.
The Fed didn’t surprise, but it also didn’t appear to satisfy. The Fed’s July 29 decision to leave interest rates in their 3.75%-4% range wasn’t unexpected, but Chairman Kevin Warsh’s opaque press conference appeared to disappoint the market. The SPX, which briefly pushed into positive territory when Warsh began speaking, ended the day with a 1.5% loss.
The central bank may have a “credibility gap.” The Fed’s apparent reluctance to hike rates—despite the five-plus year of above-target inflation and the Chairman’s description of inflation as a “choice”—may have left many investors guessing about the Fed’s decision-making criteria. Morgan Stanley & Co. economists believe the Fed will remain on hold this year, but they concede that stickier inflation remains a risk to that outlook.2
Earnings season got off to strong start. At the end of July, the blended year-over-year earnings growth rate for the S&P 500 was 47.4%—which, if it holds, would be the highest rate since the second quarter of 2021.3 However, strong results were sometimes overshadowed by concern about the sustainability of the AI hyperscalers’ (Alphabet, Amazon, Microsoft, Meta) spending levels. Alphabet and Meta both initially declined after releasing earnings, while Amazon and Microsoft rallied.
But good earnings results may have been challenged by lofty expectations. The Morgan Stanley Wealth Management Global Investment Council (GIC) pointed out that poor market response to upside earnings surprises could indicate “investor concerns around peak growth rates, margins and/or pricing power.” They added that while Morgan Stanley & Co.’s base-case S&P 500 target for the year ahead remains 8,300, the ride could be bumpy.4
Morgan Stanley & Co. analysts described the recent sell-off in AI infrastructure stocks as more technical than fundamental.
Insight of the month: Buying the AI infrastructure dip. Despite potential risks, Morgan Stanley & Co. analysts remain bullish on the "Intelligence Superhighway"—most notably, because the “demand for compute” will likely significantly exceed supply for many years to come.5 They describe the recent sell-off in AI infrastructure stocks (which includes semiconductors and electronic components) as more technical than fundamental, and highlight key strategic areas and specific companies that may be positioned to benefit.5
Is the market rotating to quality? The US stock market is undergoing a “classic mid-cycle transition,” according to Morgan Stanley & Co. strategists. The current setup, they say, resembles early-to-mid 2021, when leadership shifted toward quality after a run of more speculative growth and lower-quality leadership after the COVID crisis. In addition to highlighting 7,000 as a potentially strong support level for the SPX, the strategists note that AI hyperscalers should outperform semiconductors, while AI adopters are likely to outperform both.6
August market history. August hasn’t been a consistently stronger-than-average month for US stocks, and it’s been weaker than average over the past 35 years. Since 1991, August was a positive month less often (20 of 35 years) than any other month but September. The S&P 500’s 0.5% median August return was the third-lowest of all months during that period.7
Important August dates: Employment Report (8/7), CPI (8/12), PPI (8/13), Retail Sales (8/14), Housing Starts (8/18), FOMC minutes (8/19), PCE Price Index (8/26), Q2 GDP, second estimate (8/26).
Click here to log on to your account or learn more about E*TRADE's trading platforms, or follow the Company on X (Twitter), @ETRADE, for useful trading and investing insights.
1,4 MorganStanley.com. The GIC Weekly: Headwinds. 7/27/31.
2 MorganStanley.com. July FOMC Reaction: A Question of Credibility. 7/30/26.
3 FactSet. Earnings Insight. 7/31/26.
5 MorganStanley.com. Playing the AI Infrastructure Dip: Where to Invest and Where We See Risk. 7/27/26.
6 MorganStanley.com. Weekly Warm-up: The Broadening Out Shifts to a Quality Rotation as Early Cycle Phase Ends. 7/27/27.
7 Figures reflect S&P 500 (SPX) monthly closing prices, 1957–2025. Supporting document available upon request.
Because of their narrow focus, sector investments tend to be more volatile than investments that diversify across many sectors and companies. Technology stocks may be especially volatile. Risks applicable to companies in the energy and natural resources sectors include commodity pricing risk, supply and demand risk, depletion risk and exploration risk. Health care sector stocks are subject to government regulation, as well as government approval of products and services, which can significantly impact price and availability, and which can also be significantly affected by rapid obsolescence and patent expirations.
Yields are subject to change with economic conditions. Yield is only one factor that should be considered when making an investment decision.