Tech presses its advantage
E*TRADE from Morgan Stanley
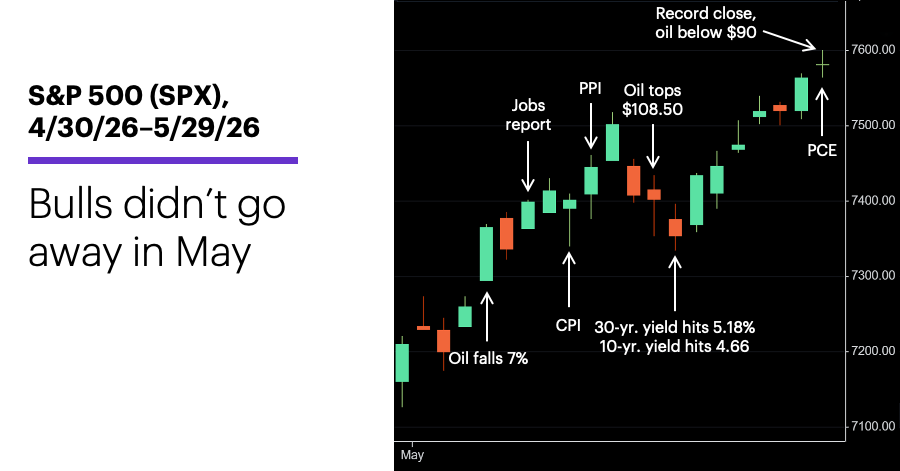
The US stock market may not have matched its April performance in May, but from a certain perspective, last month might have represented a more impressive accomplishment. While April benefited from following a nearly eight-month S&P 500 (SPX) low, May staged its well-above-average rally when the index was already at a record high.
There were bumps along the way, though. The SPX pulled back mid-month as long-term yields surged and oil prices hit their second-highest levels since the start of the Iran conflict, but both markets reversed toward the end of the month amid renewed hopes for a resolution. The S&P 500 closed May at another record high, logging its biggest two-month gain (16.1%) since May 2020:
Source: Power E*TRADE. (For illustrative purposes. Not a recommendation. It is not possible to invest directly in an index.)
Consumers feel inflation pinch, markets don’t. Stocks appeared to shrug off the rising price pressures reflected in the Consumer Price Index (CPI), Producer Price Index (PPI), and PCE Price Index last month. But as Chief Economic Strategist for Morgan Stanley Wealth Management Ellen Zentner noted after the PCE Price Index release, “Rising prices are really taking a bite out of consumption, and the decline in the savings rate shows consumers are dipping into savings to make ends meet.”
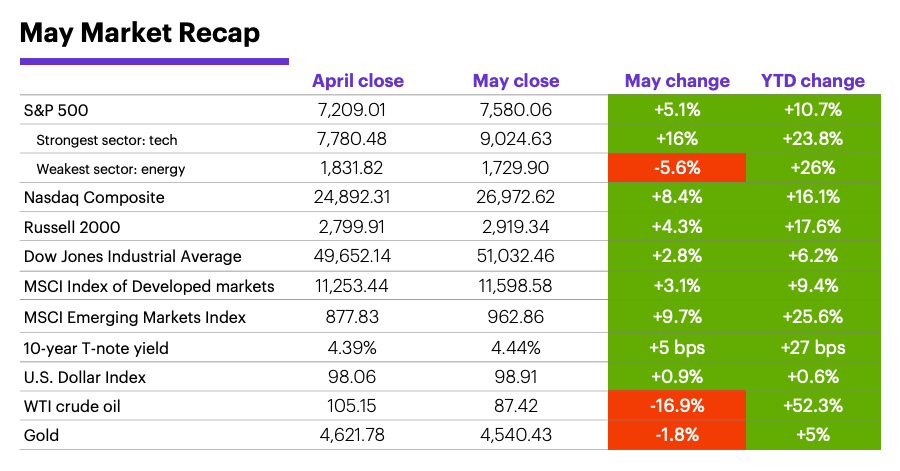
As was the case in April, the AI-fueled tech sector drove gains in May. In leading the S&P 500 last month, tech gained more than six times as much (on a percentage basis) as the next-strongest sector, health care. Eight of the S&P 500’s 11 sectors lost ground for the month, with energy posting the biggest loss.
The US stock market outpaced developed markets globally, but continued to lag emerging markets. Although the S&P 500 gained two percentage points more than the MSCI Developed Markets Index, it underperformed the MSCI Emerging Markets Index by more than four percentage points.
Oil prices eased significantly toward the end of May. Although US crude oil prices were still up more than 52% for the year, they ended May below $90—thanks mostly to a $21-plus drop in the final eight trading days of the month.
Bond yields jumped to multi-month and multi-year highs. On May 19, the 10-year Treasury yield climbed to a 16-month high (4.66%), while the 30-year yield hit a 19-year high (5.18%). Both rates retreated significantly by the end of the month, but the 10-year yield still registered its highest monthly close since January 2025. However, Morgan Stanley & Co. strategists pointed out that stocks can tolerate higher yields as long as economic growth—not a hawkish Fed shift—is the main driver.1
Data source: Power E*TRADE and FactSet. (For illustrative purposes. Not a recommendation. It is not possible to invest directly in an index.) Note: crude oil, gold, and U.S. Dollar Index data reflect spot-market prices. BPS (basis point) = 0.01%. MSCI Index of Developed Markets and MSCI Emerging Markets Index represent “total-return” performance (index change including dividend reinvestment). Past performance is not indicative of future results.
But rising rates may not simply be a reaction to the energy supply shock. Larger dynamics may be at work, according to Morgan Stanley Wealth Management. Although energy price-driven inflation will likely be short-lived, demand-side forces could be driving “structurally higher rates.” A possible result is constrained equity market valuation multiples, which could make alternative asset classes—including hedge funds, gold, REITs, infrastructure and secondaries—increasingly important to portfolio diversification.2
Higher yields may call for more stock selectivity. Although last month’s yield surge triggered a pullback in crowded AI-centric momentum trades, this move didn’t look like “a broad risk-off rotation,” according to Morgan Stanley & Co. quant strategists. With AI-driven momentum likely to continue, they outlined a more selective approach that is more closely linked to stock-specific earnings signals. 3
A new Fed chief won’t alter the Fed’s “wait-and-see” posture. The Federal Reserve will have a new chairman for its June 16-17 policy meeting, but the outcome should be familiar, according to Morgan Stanley & Co. economists. While minutes from the Fed’s previous meeting showed a majority of the board acknowledged that rate cuts could become appropriate if inflation remained persistently above target, the economists expect inflation to slow in 2027, opening the door to rate cuts.4
The 2026 World Cup could represent a market event as well as a sporting event.
Insight of the month: World Cup—Beyond the Pitch. Morgan Stanley & Co. analysts expect multiple stocks across the media and entertainment ecosystem to benefit from this summer’s FIFA World Cup, noting that that this year’s event combines “increased inventory, favorable time zones, elevated corporate sponsorship demand, and structurally stronger streaming monetization.”5
June market history. June was an up month for the S&P 500 in nine of the past 10 years, but its longer-term performance has been mediocre. From 1957-1990, it had the third-weakest median return (-0.2%) of any month and was down more often than up (18 vs. 16). Since 1991, it’s been a positive month 60% of the time (fifth-weakest) with a +0.2% median return (weakest). However, above-average May strength (like this year’s) has tended to spill over: June was positive after 10 of the 11 strongest Mays since 1957, all of which had returns of 4.4% or higher.6
Important June dates: Employment Report (6/5), CPI (6/10), PPI (6/11), Housing Starts (6/16), Retail Sales (6/17), Fed interest rate decision (6/17), US markets closed for Juneteenth (6/19), PCE Price Index (6/25), GDP (6/25).
1 Weekly Warm-Up: Thoughts from the Road: Pt. 2. 5/26/28.
2 MorganStanley.com. The GIC Weekly: Supply and/or Demand? 5/26/26.
3 MorganStanley.com. AI-Led Momentum in a Higher-Rate World: Stay Exposed, Get More Selective. 5/22/26.
4 April FOMC Minutes: Desire for a two-sided reaction function. 5/20/26
5 MorganStanley.com. The CR7 Effect—FIFA World Cup Implications For M&E. 5/27/28.
6 Figures reflect S&P 500 (SPX) monthly closing prices, 1957–2025. Supporting document available upon request.
Because of their narrow focus, sector investments tend to be more volatile than investments that diversify across many sectors and companies. Technology stocks may be especially volatile. Risks applicable to companies in the energy and natural resources sectors include commodity pricing risk, supply and demand risk, depletion risk and exploration risk. Health care sector stocks are subject to government regulation, as well as government approval of products and services, which can significantly impact price and availability, and which can also be significantly affected by rapid obsolescence and patent expirations.
Yields are subject to change with economic conditions. Yield is only one factor that should be considered when making an investment decision.