Big first half for small caps
E*TRADE from Morgan Stanley
There were several catalysts that contributed to shifting market sentiment and a pullback in the S&P 500 (SPX) in June—ups and downs in US-Iran negotiations, the first Fed meeting under new Chair Kevin Warsh, challenging inflation data, a record IPO—but they mostly took a back seat to the tech sector’s swings.
Those, of course, were driven in large part by the semiconductor space, especially the stocks of companies in the memory business. While AI-driven demand has sent many of them soaring this year, volatility within the chip arena spiked in June, with some of the higher-profile stocks, such as Micron (MU) and Sandisk (SNDK), posting multiple daily moves in excess of +/-10%. That volatility spilled over into early July, as semiconductors pulled back across the board.
After posting its most recent record high on June 2, the SPX zigzagged mostly to the downside, although it rebounded robustly in the final days of the month:
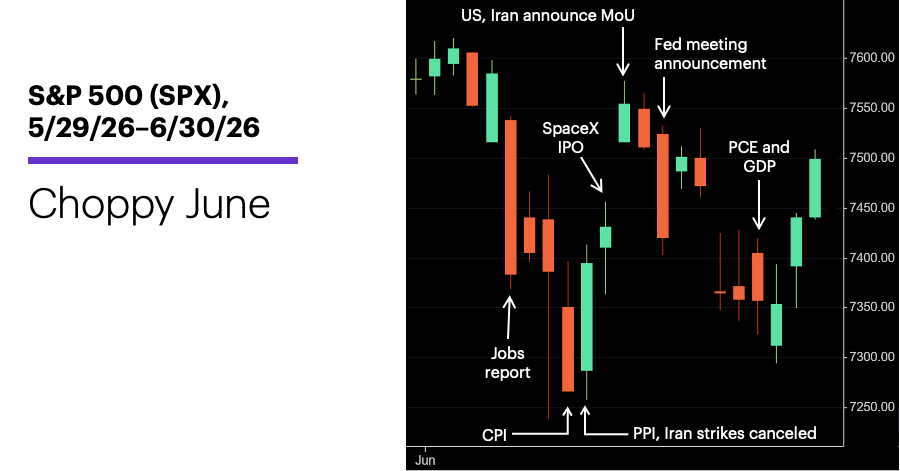
Source: Power E*TRADE. (For illustrative purposes. Not a recommendation. It is not possible to invest directly in an index.)
Despite June’s pullback, the US stock market is enjoying an above-average year so far. The S&P 500’s 14.9% Q2 return was its third-biggest of the past 23 years, and more than twice as large as its median positive Q2 since 1957. Also, the index’s 9.6% return for the first half was larger than the 8.9% median return for positive H1s over the past 69 years.
Industrial stocks led the S&P 500 last month, while communications services was the weakest sector. Despite the SPX’s loss for the month, seven of its 11 sectors gained ground.
The US stock market fell less than emerging markets in June, but still trail them for the year. The MSCI Developed Markets Index outperformed the SPX for the month, posting a small gain in June.
Small caps capped a big first half with a market-leading June. At the midpoint of the year, the Russell 2000 (RUT) small-cap index had gained nearly 12 percentage points more than the S&P 500—its biggest differential (in a year when both indexes were positive for the year) since 1991. Almost all of the RUT’s year-to-date return came in its +21.2% second quarter.
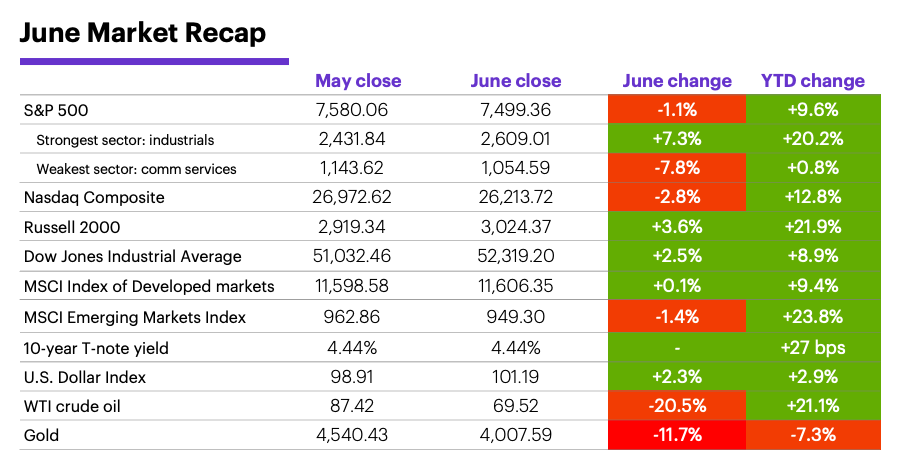
Data source: Power E*TRADE and FactSet. (For illustrative purposes. Not a recommendation. It is not possible to invest directly in an index.) Note: crude oil, gold, and U.S. Dollar Index data reflect spot-market prices. BPS (basis point) = 0.01%. MSCI Index of Developed Markets and MSCI Emerging Markets Index represent “total-return” performance (index change including dividend reinvestment). Past performance is not indicative of future results.
Focus on the “subtler realities with potentially longer-term implications” rather than tech volatility, suggest Morgan Stanley Wealth Management strategists. Multiple forces—accelerating AI capital needs, swelling sovereign debt, and policymaker preferences to run the economy hot—could drive higher real interest rates, which may pressure stock valuations and raise the stakes for corporate earnings. The strategists suggest balancing passive US stock index exposure with active stock-picking or equal-weighted exposure, preferring maximum sector and regional diversification.1
Recent underperformance in the chip space may be helping market broaden. The past couple of years has included multiple pivots between different types of AI beneficiaries in the market. Morgan Stanley & Co. strategists expect those rotations to continue, including a shift from semiconductors to AI hyperscalers, although they note choppy, weaker market conditions could persist as the shift unfolds. The strategists also argue that the steep fall in oil has helped stabilize rates, which has fueled rotation into lagging areas of the market. Among these, they favor consumer discretionary goods, transports, and biotech.2
The Middle East appeared to lose some of its impact as a stock market catalyst in June. While the “Memorandum of Understanding” (MoU) the US and Iran announced on June 15 to reopen the Strait of Hormuz didn’t necessarily resolve outstanding issues between the two countries, oil prices retreated significantly last month and, as the month wore on, stock investors appeared to react less to the occasional rhetorical and military flare-up.
The oil picture has come full circle, according to Morgan Stanley & Co. analysts. The Strait is reopening faster than expected, and data suggests the potential for a developing physical oil glut and an expected surplus for 2027.3
Heading into earnings season, Morgan Stanley & Co. analysts are positive on banks in general, but favor larger-cap names over mid-caps.
Insight of the month: Bank earnings preview. With Q2 reporting season around the corner, Morgan Stanley & Co. analysts have a positive view on the group that will kick it off—banks. While both large and mid-cap banks benefit as revenue momentum continues to build, the analysts favor larger-cap names because of their “stronger capital markets and higher likelihood of guidance raises.”4
Conditions continue to point to an “on hold” Fed, despite new leadership. Morgan Stanley & Co. economists noted the Federal Reserve’s June 17 statement, forecasts, and press conference were hawkish, with new Chair Kevin Warsh focused on lowering inflation to 2% and showing little concern about labor-market strength (despite the softer-than-expected jobs report on July 2). However, the economists continue to be optimistic that inflation will ease, forecasting the Fed will remain on hold the remainder of the year, rather than hiking rates.
July market history. July has been a positive month for the S&P 500 (SPX) for the past 11 years, but its longer-term history is more checkered. Overall, July has been positive in 39 of the past 69 years (56.5%, the fourth-lowest win rate), but from 1957 through 2005, it had the second-worst median return and second-lowest winning percentage of any month (-0.4% and 47%, respectively). On a percentage basis, it was an up month slightly more often after down Junes than up Junes (58.1% vs. 55.3%).5
Important July dates: Employment Report (7/2), FOMC minutes (7/8), CPI (7/14), PPI (7/15), Retail Sales (7/16), Housing Starts (7/17), Fed interest rate decision (7/29), PCE Price Index (7/30), Q2 GDP (7/30).
1 MorganStanley.com. The GIC Weekly: The “Real” Risk. 6/29/26.
2 MorganStanley.com. Weekly Warm-up: The Broadening Gains Steam as Semis Lose Momentum. 7/6/26.
3 MorganStanley.com. Full Circle – Focus Shifts Back to 2027 Surplus. 6/29/26.
4 MorganStanley.com. 2Q26 Earnings Preview: Leaning Large. 6/29/26.
5 Figures reflect S&P 500 (SPX) monthly closing prices, 1957–2025. Supporting document available upon request.
Because of their narrow focus, sector investments tend to be more volatile than investments that diversify across many sectors and companies. Technology stocks may be especially volatile. Risks applicable to companies in the energy and natural resources sectors include commodity pricing risk, supply and demand risk, depletion risk and exploration risk. Health care sector stocks are subject to government regulation, as well as government approval of products and services, which can significantly impact price and availability, and which can also be significantly affected by rapid obsolescence and patent expirations.
Yields are subject to change with economic conditions. Yield is only one factor that should be considered when making an investment decision.