July stock market history
- July a positive month for SPX in 56.5% of past 69 years
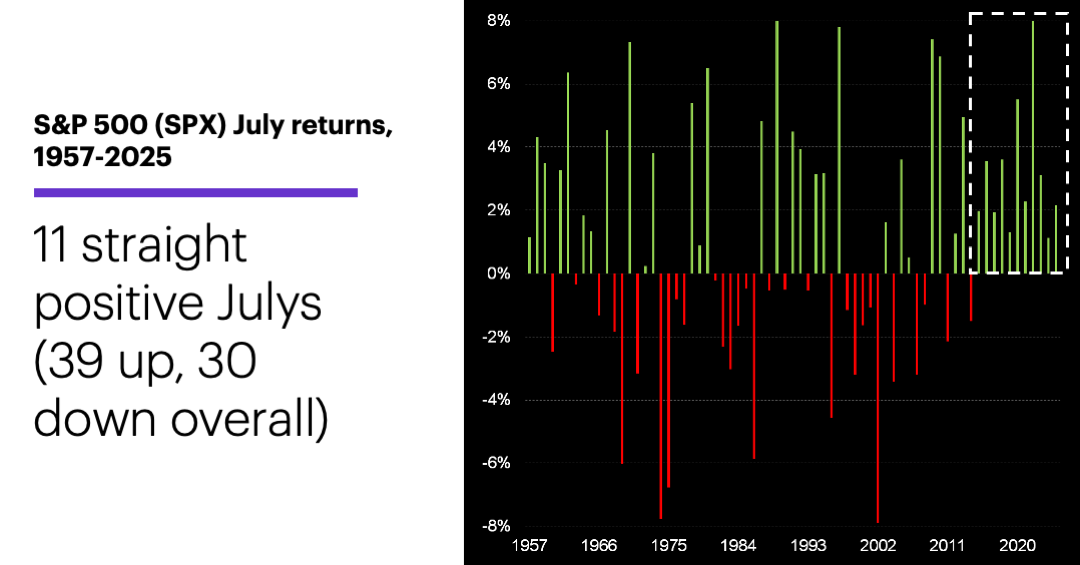
- Current positive run longest in modern SPX history
- Gains tended to concentrate early in the month
Similar to June, July is a month with a longer-term history of mediocre net stock-market performance that has recently experienced an unusually strong run.
But July really has been in a league of its own over the past decade or so. It’s been a positive month for the S&P 500 (SPX) for 11 years in a row— currently the longest streak of any month, and the second-longest of the past 69 years, trailing only the 13-year run May enjoyed from 1985-1997:
Source: Power E*TRADE. (For illustrative purposes. Not a recommendation. Note: It is not possible to invest directly in an index.)
July’s recent strength has also been responsible for its more-than-solid statistics over the past 20 years, when it was an up month 16 times—tied for first place in that department. July’s increased bullishness in recent decades is part of a larger shift that has seen May and June also perform notably better since 1991 than they did from 1957-1990.
As the chart also shows, July’s returns were much more of a mixed bag prior to 2006. In fact, from 1957 through 2005, July had the second-worst median return and second-lowest winning percentage of any month of the year (-0.4% and 47%, respectively). Overall, July has been positive in 39 of the past 69 years (56.5%, fourth-lowest win rate).
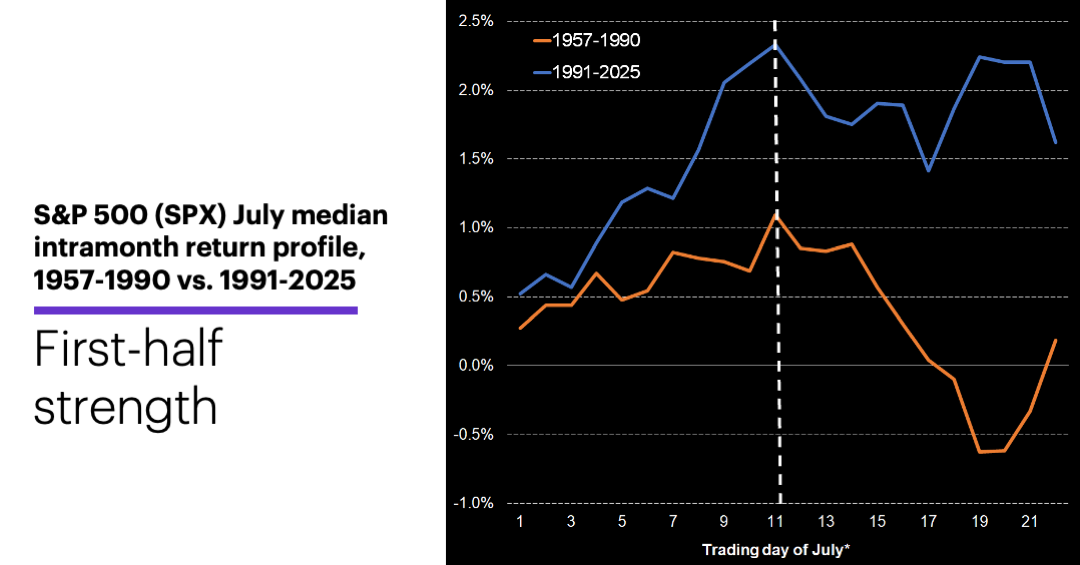
However, one aspect of July that has been relatively consistent over the years is that its gains have tended to occur mostly in the first half of the month. The following chart shows July’s intramonth return profile (its median returns from the last trading day of June to each trading day of July) for two periods, 1957-1990 (red) and 1991-2025 (blue):
Source: Power E*TRADE. (For illustrative purposes. Not a recommendation. Note: It is not possible to invest directly in an index.)
While the chart highlights the larger total-month returns in the more recent period, it also shows gains tended to peak around mid-month (trading day 11) for both. The difference is that while the market had a habit of giving back its first-half gains in the 1957-1990 period, it was more likely to hold on to them in the 1991-2025 period. In both periods the SPX’s net return from trading day 1-11 was larger than its net return from trading day 11-22: 20 out of 34 times from 1957-1990 and 23 out of 35 times from 1991-2025.
Finally, on a percentage basis, July was an up month slightly more often after down Junes than up Junes. July had a positive return after 21 of 38 up Junes (55.3%) and after 18 of 31 down Junes (58.1%).
Today’s numbers include (all times ET): S&P-Case-Shiller Home Price Index (9 a.m.), FHFA House Price Index (9 a.m.), Chicago PMI (9:45 a.m.), Consumer Confidence (10 a.m.), Job Openings and Labor Turnover Survey (10 a.m.).
Today’s earnings include: Nike (NKE), Constellation Brands (STZ).
Click here to log on to your account or learn more about E*TRADE's trading platforms, or follow the Company on Twitter, @ETRADE, for useful trading and investing insights.
1 All figures reflect S&P 500 (SPX) monthly and daily closing prices, 1957-2025. Note: Depending on the year, “trading day 22” may represent the final day of July or the first day of August. Supporting document available upon request.