Support, resistance, and crude oil
- Oil prices fell into key technical zone on Monday
- Market mostly sideways since June surge and retreat
- Will traders once again “respect the zone”?
A casual trader with a vague feeling that crude oil prices haven’t done much in recent months could be considered absolutely right and dead wrong at the same time.
Despite trading as low as $54.10 in April and as high as $73.38 in June—a 36% price swing—November WTI crude oil futures have repeatedly returned to the low $60s over the past five months. On Monday, the market was again approaching this level, pulling back after hitting a nearly two-week high early last week:
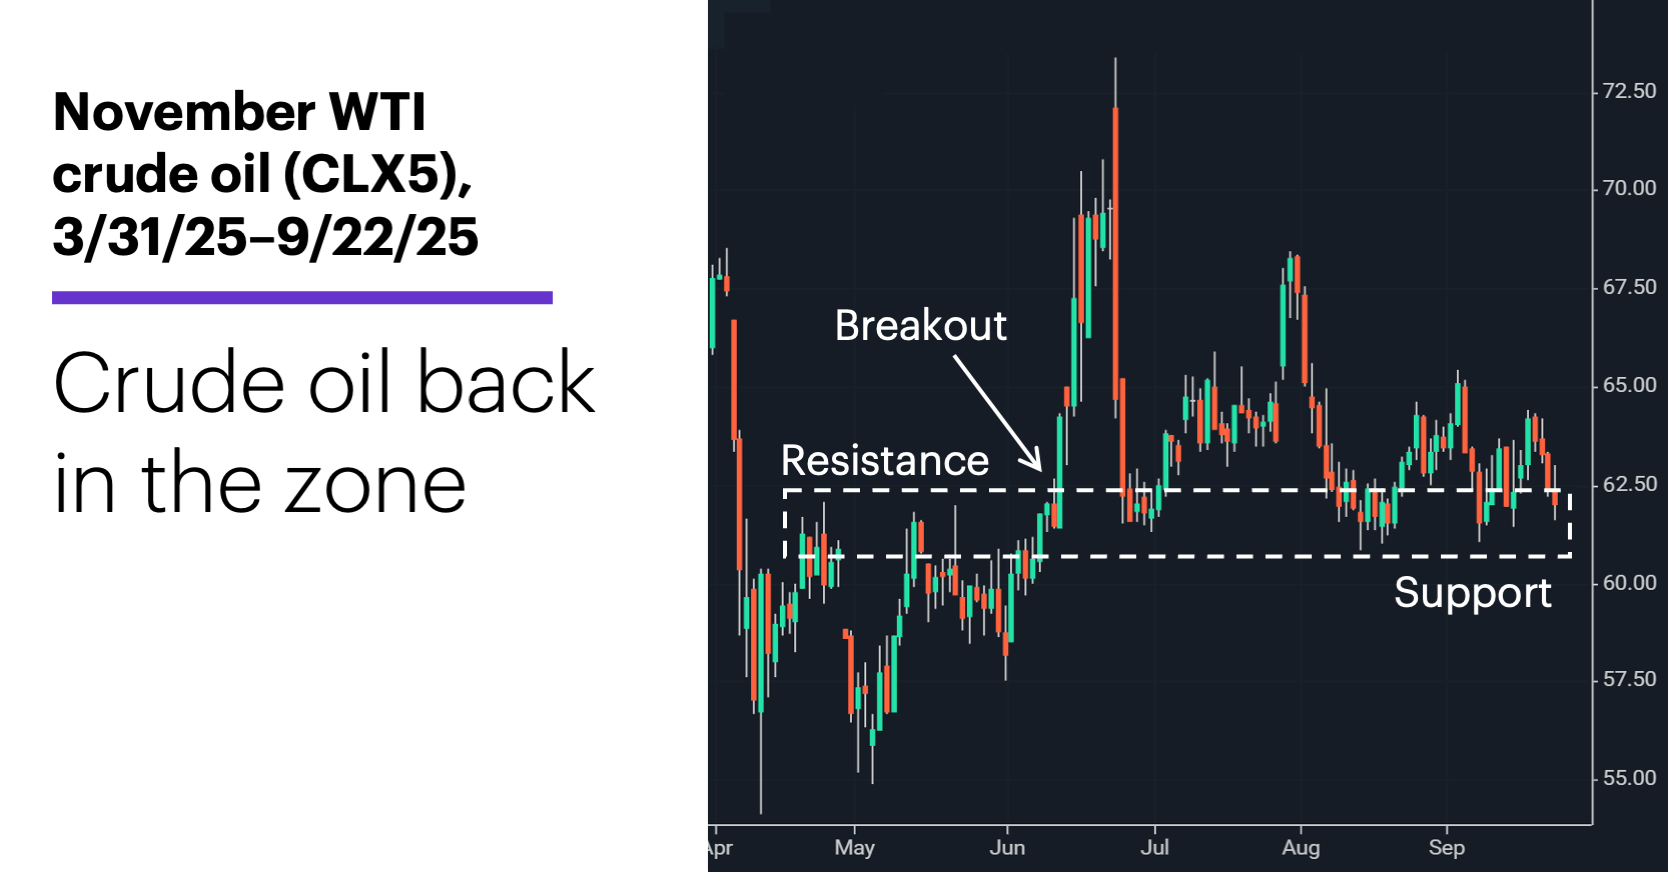
Source: Power E*TRADE. (For illustrative purposes. Not a recommendation.)
This is simply a way of saying oil prices have established a noticeable support-resistance level, although as the chart makes clear, it is better thought of as a general price zone than a specific level.
When the market was attempting to rally off its early-April lows, it twice (in late April and mid-May) turned lower around $62, establishing this level as resistance—a price “ceiling” turning back efforts to push prices higher.
Bulls burst through that resistance with June’s breakout (triggered by Israeli and US airstrikes on Iran), sending prices up as much as 19.4% in nine days. However, the market reversed even more abruptly, returning to the level of the April-May highs before stabilizing and rebounding.
Over the next few months it became clear that the former resistance level had transformed into support, as prices repeatedly rebounded after falling to the same approximate level—some of the intraday lows were, in fact, a little below $61. Nonetheless, the zone between roughly $61 and $62 encompasses many of the market’s most significant short-term inflection points since late April.
Now, of course, the question is whether bulls will once again support prices at these levels. If they don’t, bears could at least temporarily gain the upper hand and push prices out of the bottom of the zone, in which case many buyers (old and new) may be forced out of their positions, potentially fueling a sharp down move.
On the fundamental side of the picture, Morgan Stanley & Co. analysts recently pointed out that industry supply-demand balances for 2025 and 2026 weakened for a fourth-straight month.1 But as they noted last month, an oil surplus has been widely anticipated, and while they thought prices could come under additional pressure, they didn’t think a sustained, significant sell-off was likely.2
Today’s numbers include (all times ET): current account (8:30 a.m.), PMI Composite flash (9:45 a.m.).
Today’s earnings include: AutoZone (AZO), Micron (MU).
Click here to log on to your account or learn more about E*TRADE's trading platforms, or follow the Company on Twitter, @ETRADE, for useful trading and investing insights.
1 MorganStanley.com. Key Agency Revisions—September 2025. 9/19/25.
2 MorganStanley.com. Heading for the Most-Anticipated Surplus. 8/21/25.