An eye on options
- WARBY put volume 184 times avg. on Tuesday
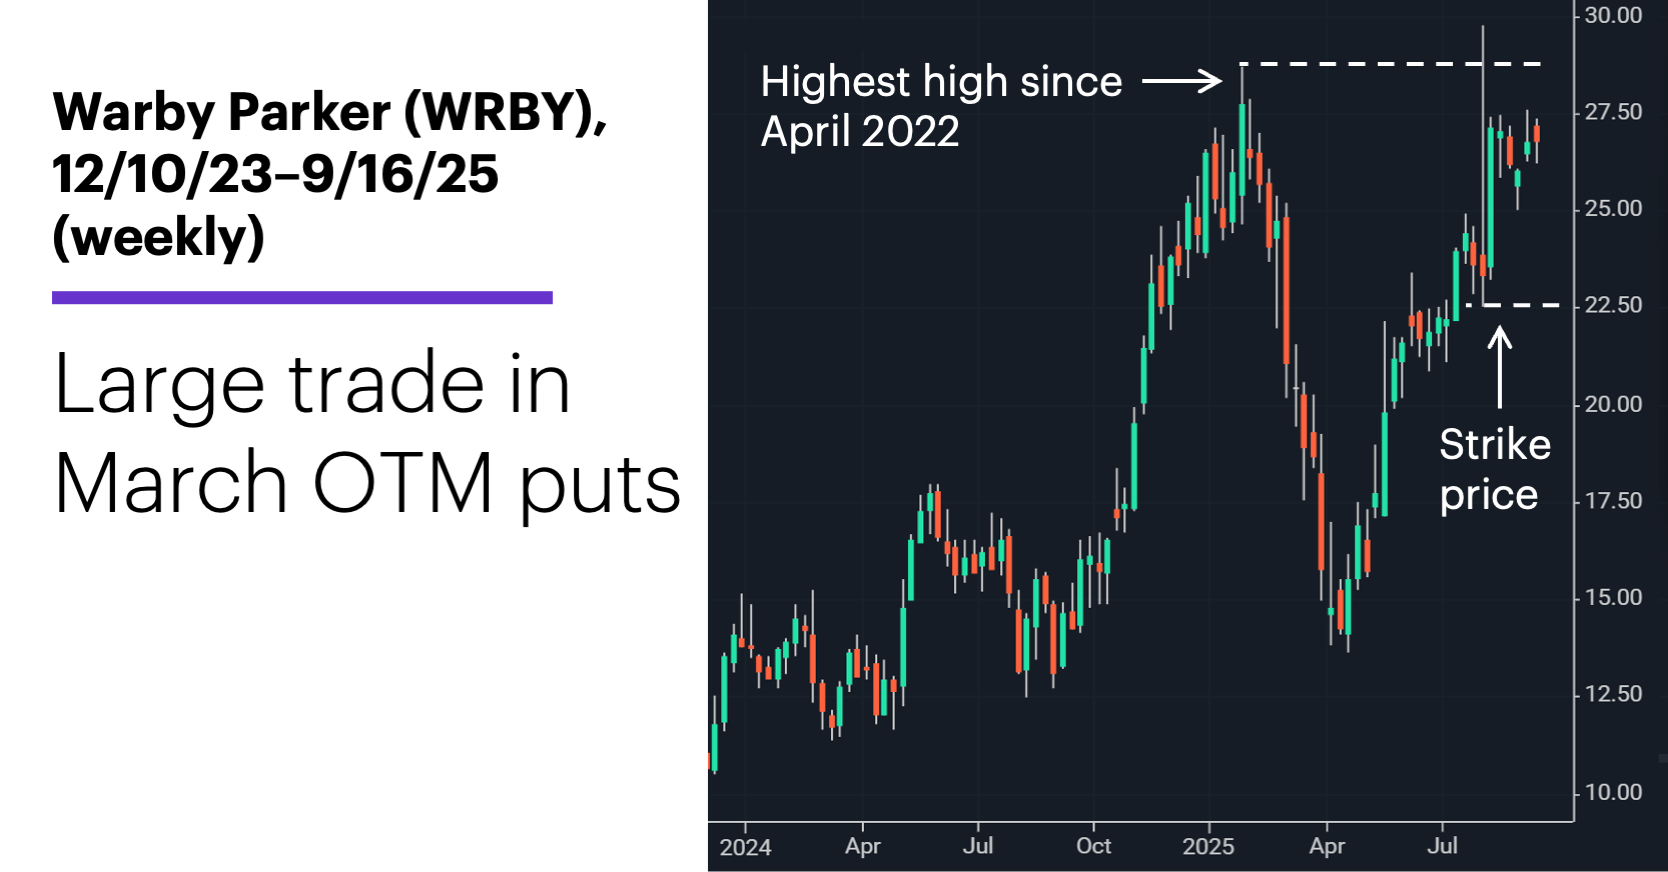
- Stock in range since testing resistance
- Does gold have more gas in its tank?
Warby Parker’s (WRBY) stock has been on a high-momentum ride this year—to the upside and the downside. After hitting its highest levels since 2022 in January, WRBY fell more than 50% to $14 in early April.
But by August 7 the stock had wiped out that correction, at least on an intraday basis. Shares jumped to fresh year-to-date highs after the company released earnings, although they pulled back to end the day lower:
Source: Power E*TRADE. (For illustrative purposes. Not a recommendation.)
Over the past few weeks the stock has been much quieter, consolidating a little below its January and April highs, but still up 14% since August 7.
A trader’s interpretation of this price action—an unsuccessful test of resistance at a prior high, or a stock resuming its climb after a pause—will likely color their perception of an unusually large options trade that occurred on Tuesday—10,000 of the March $22.50 puts.
Some traders may simply see this as a protective hedge for a large stock position, or a bullish short-put position worth $2,050,000 (the options traded around $2.05), which the trader would get to keep (at expiration) as long as the stock remained above $22.50.
Other traders, though, may see it through the eyes of a put buyer, which implies a bearish outlook on the stock. Since these are out-of-the-money (OTM) options (the strike price is below the stock price), the options would have no value at expiration unless the stock declines at least 16% below Tuesday’s level.
Two final points: First, this wasn’t necessarily a short-term trade, since the options won’t expire for another six months. Second, new trades could take place today (or tomorrow, etc.) that could cast Tuesday’s activity in a new light.
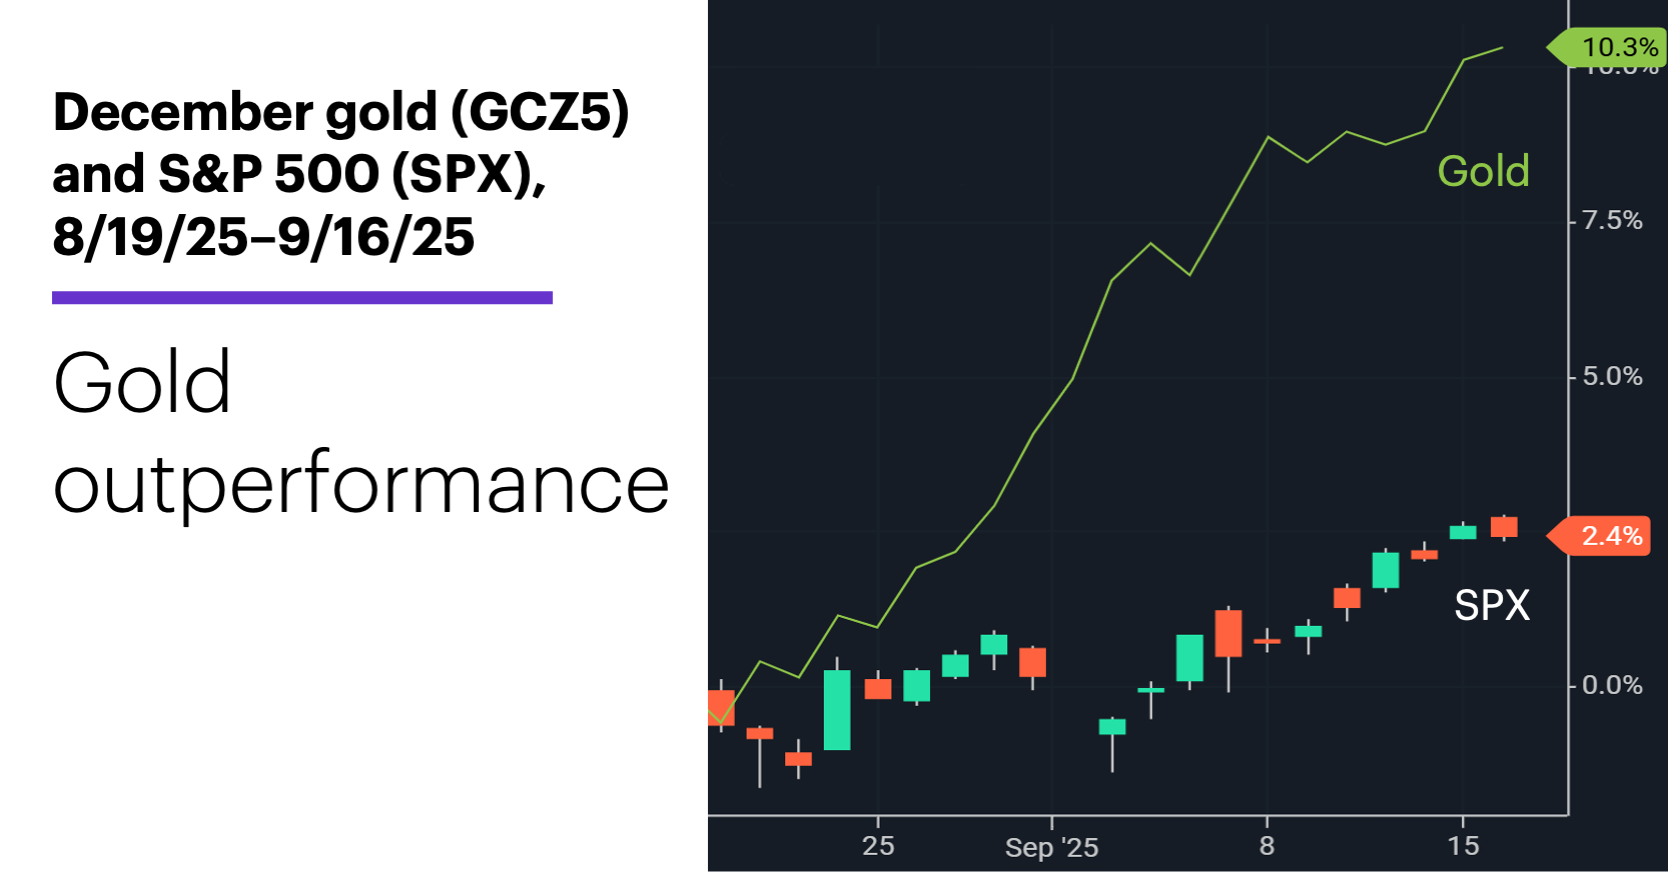
Market Mover Update: While the stock market’s all-time highs have made plenty of news, gold has been matching the S&P 500 (SPX) record for record lately.
Actually, on a year-to-date basis, the race hasn’t been particularly close, with spot gold up roughly 40% as of Tuesday—more than three times as much as the S&P 500’s (SPX) 12.5% gain. And since August 19, December gold futures (GCZ5) have outgained the SPX more than four to one, 10.3% vs. 2.4%:
Source: Power E*TRADE. (For illustrative purposes. Not a recommendation. Note: It is not possible to invest directly in an index.)
Gold has benefited from several tailwinds, according to Morgan Stanley & Co. analysts, including strong (global) central bank buying, continued inflation hedging, safe-haven buying amid continued macro uncertainty, and inflows into gold-backed ETFs hitting their highest levels outside of 2020.1 A possible tailwind: weakening jewelry demand, which represents a significant portion of the precious metals market.
The strategists also point out that gold has tended to perform well after Fed rate cuts—on average, gaining 6% in the 60 days following the start of a Fed rate-cutting cycle.
Today’s numbers include (all times ET): housing starts and building permits (8:30 a.m.), Fed interest rate decision (2 p.m.).
Today’s earnings include: Cracker Barrel (CBRL), General Mills (GIS), Lennar (LEN).
Click here to log on to your account or learn more about E*TRADE's trading platforms, or follow the Company on Twitter, @ETRADE, for useful trading and investing insights.
1 MorganStanley.com. While Gold Still Holds Glitter in Markets. 9/10/25.