Resetting expectations, reassessing opportunities
- DRI fell more than 10% intraday on Thursday
- Second-largest earnings sell-off in five years
- Stock was higher two weeks later 75% of the time
On Thursday, Olive Garden operator Darden Restaurants (DRI) fell more than 10% intraday after an earnings miss, dropping the stock to its lowest level since early April. Shares did manage to pare their losses later in the day, closing down 7.7%, but it was a notable setback for a stock still trying to reclaim record levels after a sharp July downturn:
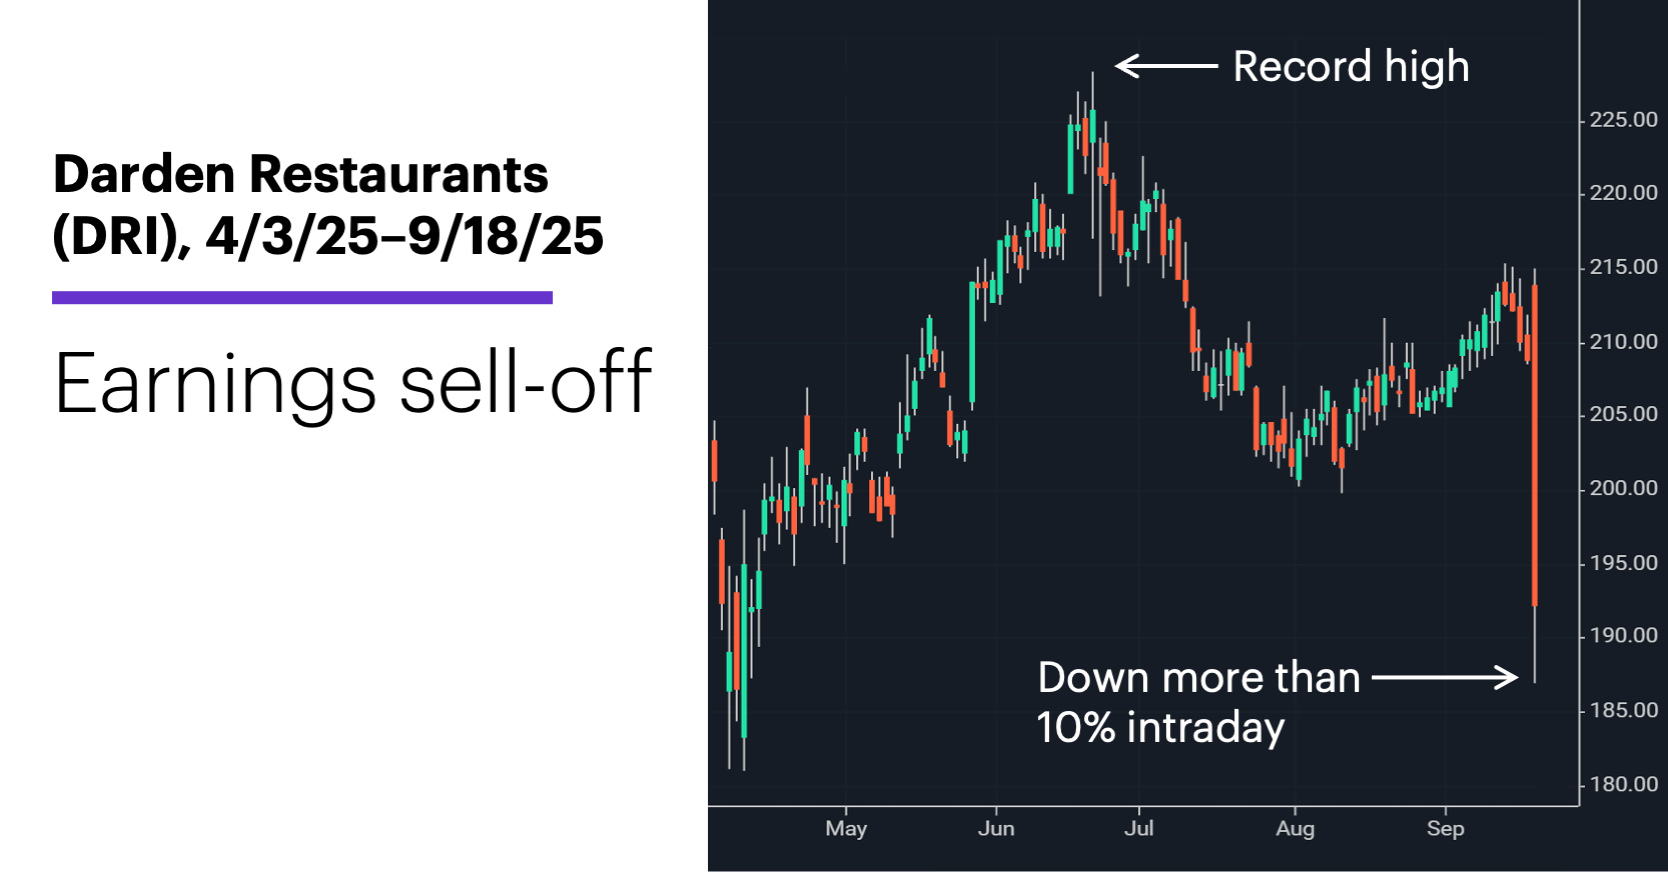
Source: Power E*TRADE. (For illustrative purposes. Not a recommendation.)
While this may seem to be a rather run-of-the-mill earnings move to some traders, it’s far from ordinary for DRI. It was not only DRI’s second- biggest earnings-day decline in more than five years, it was one of its bigger down days of the past three decades. Since 1995, DRI has closed down 7% or more just 40 other times.
Looking at the event purely from a price-action perspective, the historical record shows the stock usually rebounded from similar days in the short term. The following chart compares the stock’s median return five, 10, 15, and 20 days after 7%-or-larger down days (green line) to its median returns for all five-, 10-, 15- and 20-day periods since 1995 (blue line):
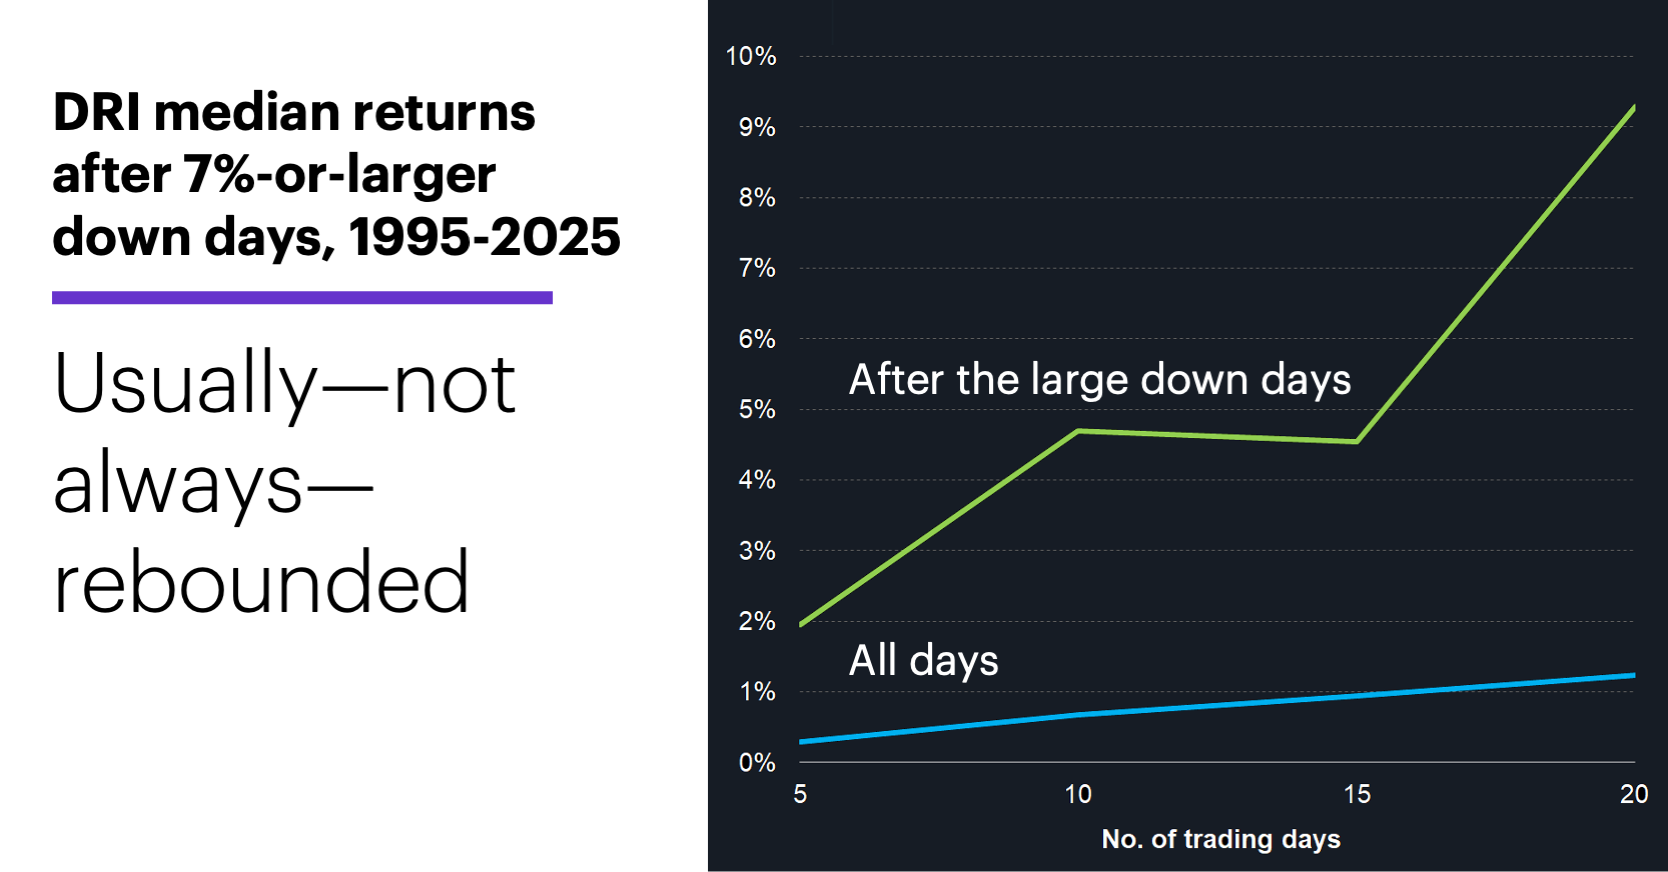
Source: Power E*TRADE. (For illustrative purposes. Not a recommendation. Note: It is not possible to invest directly in an index.)
The stock’s typical returns after the large down days were much larger than its benchmarks. For example, DRI’s median return for all 10-trading-day periods was 0.7%—less than one-sixth of its 4.7% median return 10 days after the sell-offs. Also, shares were higher at the 10-day mark after 30 of the 40 down days. The median return 20 trading days after the sell-off days topped 9%.
Of course, the green line in the chart is a composite of 30 price moves—unique situations with unique catalysts. Even though the stock usually rebounded after the 7%-or-larger down days, it didn’t always recover. In one instance (during the 2020 COVID sell-off), DRI fell an additional 50% over the next 20 trading days.
Taking a step back, Morgan Stanley & Co. analysts maintained their longer-term Overweight rating on DRI after the earnings release, describing the results as “very good” on an absolute basis, but perhaps disappointing because of high expectations. And while they expect some “valuation reset” they also describe DRI pullbacks as potential opportunities.2
Click here to log on to your account or learn more about E*TRADE's trading platforms, or follow the Company on Twitter, @ETRADE, for useful trading and investing insights.
1 MorganStanley.com. Reflects Darden Restaurants (DRI) daily closing prices, 1995-2025. Supporting document available upon request.
2 MorganStanley.com. F1Q26 First Take: Modestly Short on KPIs; Bottom Line Stands for FY. 9/18/25.