Breaking down September
- Stock market dropped to start September
- Second week of month often stronger
- Weakness more common later in month
Given the steady drumbeat of reminders about “seasonal weakness”—specifically, September’s track record as the softest month of the year for the stocks—Tuesday’s sell-off may have felt inevitable to many traders and investors. As if on cue, the market dropped on the first trading day of its most bearish month.
While being aware of September’s historical net weakness may be helpful, it doesn’t provide much insight into how the month’s performance varied from year to year, or how that weakness tended to play out. A minor example: Tuesday’s sell-off was atypical, since the S&P 500 (SPX) has usually rallied on the first day of September.
“New faces highlight market push” noted that September was actually evenly split between net gains and losses over the most recent 34 years. But it also pointed out that even during this more-bullish (or, more accurately, “less-bearish”) period, September losses still tended to be bigger than September gains. Since 1991 (to the right of the dashed line), the SPX fell 7% or more in September six times, but gained more than 7% just once:
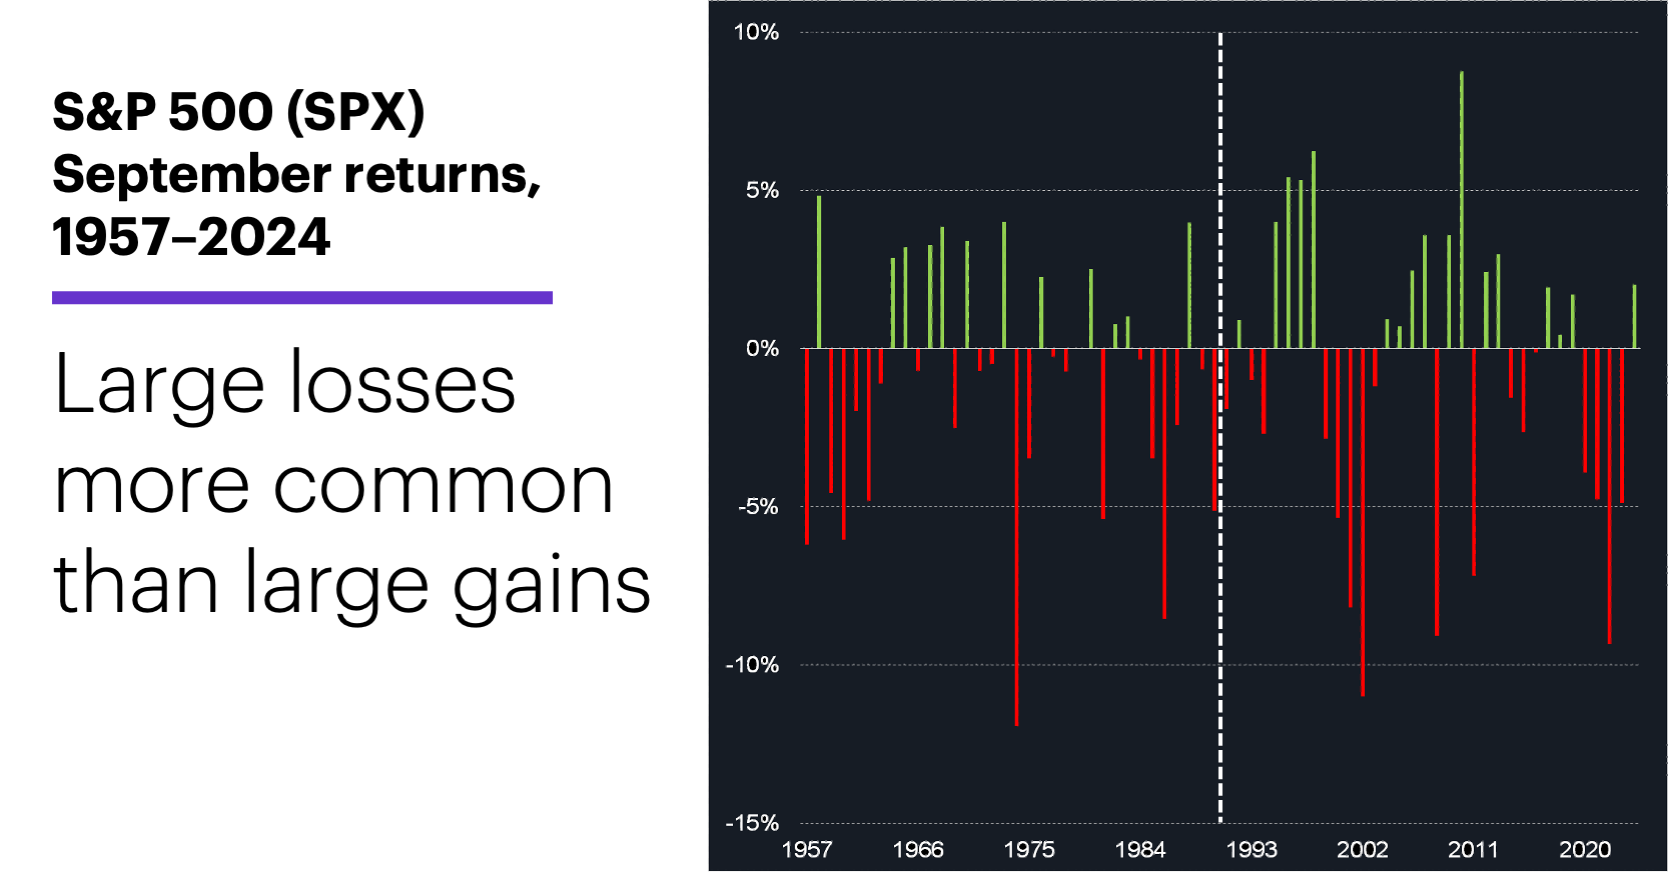
Source: Power E*TRADE. (For illustrative purposes. Not a recommendation.)
A similar dynamic shows up at the daily level. The chart below shows the SPX’s average daily return for each trading day of September between 1991 and 2024.1 Not only did 12 out of 21 days have negative average returns, five days had average losses of -0.2% or more, while only three days had average gains of +0.2% or more:
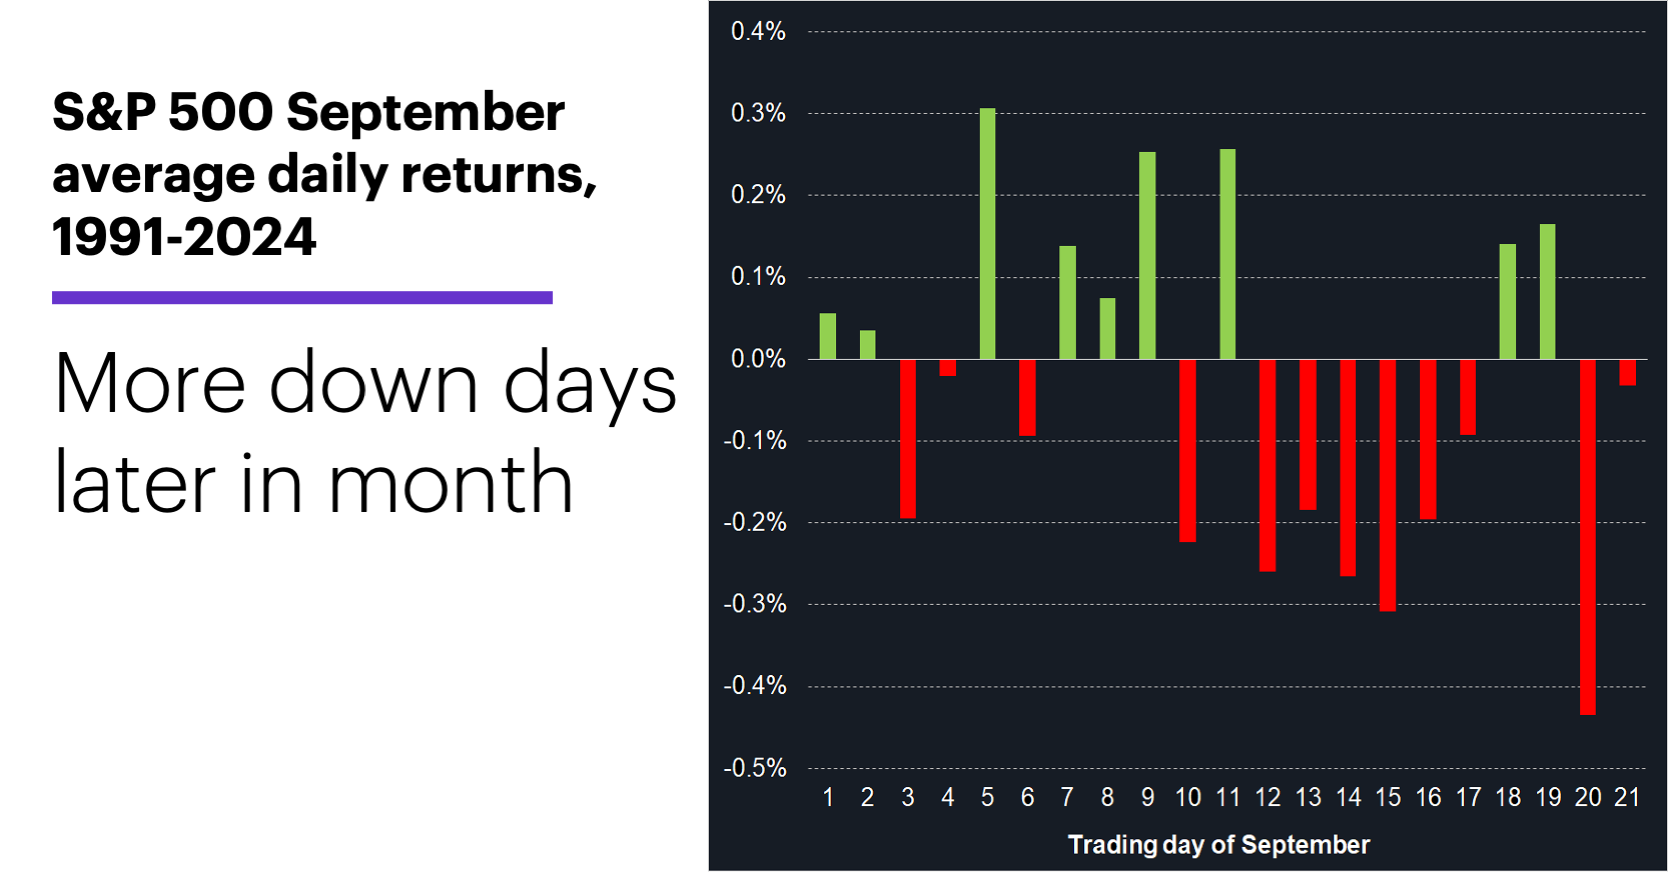
Source: Power E*TRADE. (For illustrative purposes. Not a recommendation.)
The most telling characteristic of this chart is the greater frequency of average losses in the latter half of September. After the 11th trading day of the month, all but two days had negative average returns.
That tendency produces the intramonth return profile shown below, which represents the SPX’s average month-to-date return throughout September, measured from the last trading day of August:
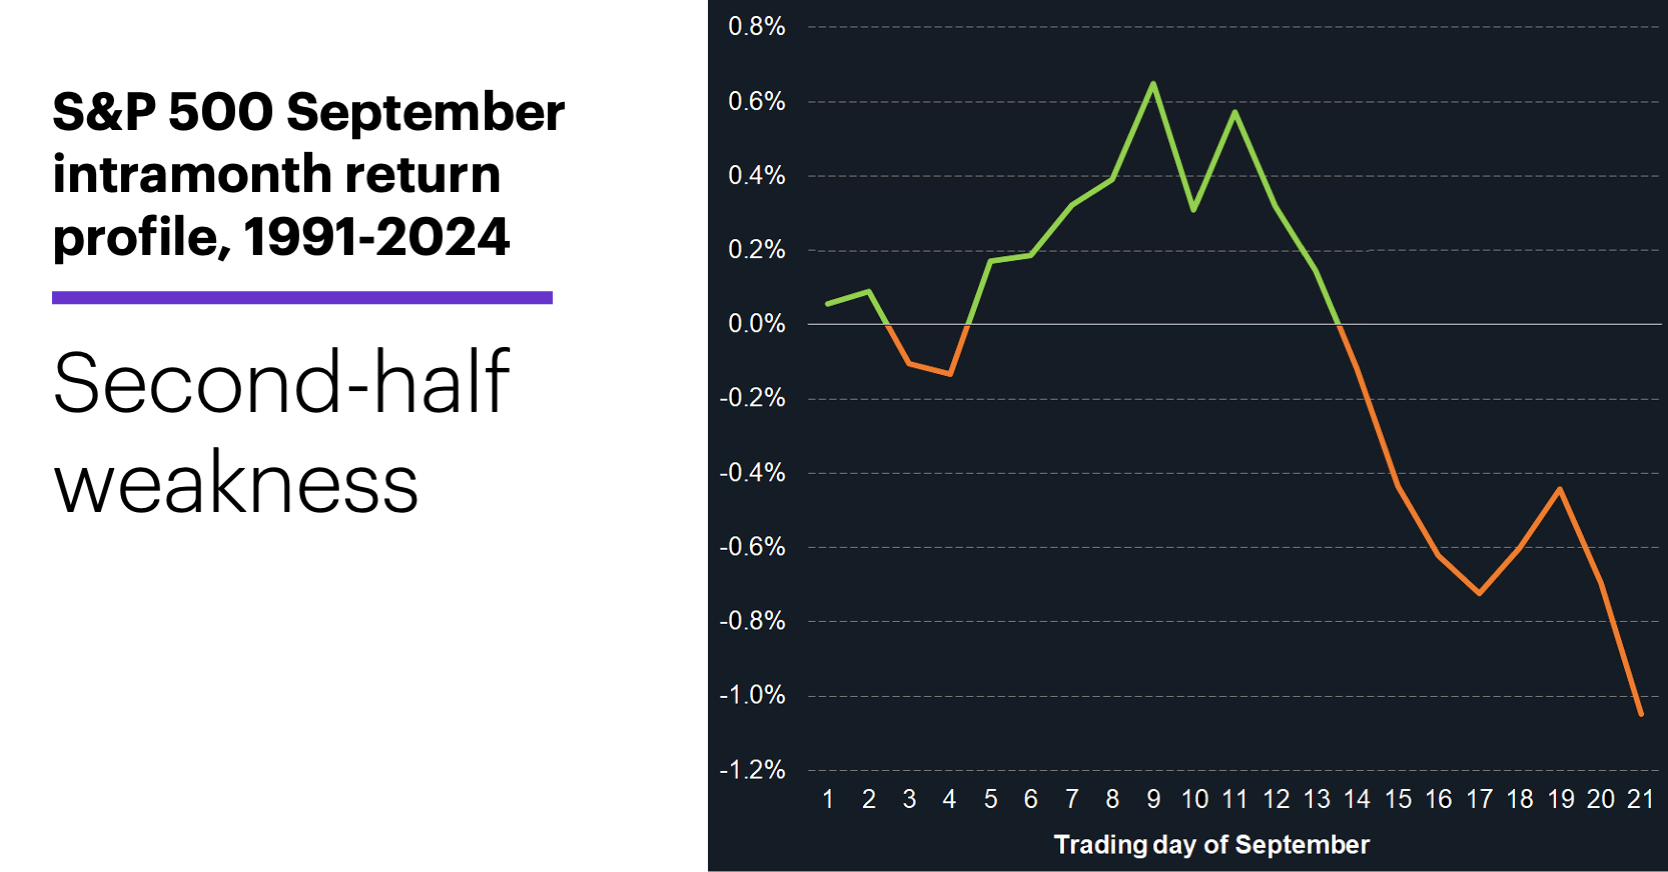
Source: Power E*TRADE. (For illustrative purposes. Not a recommendation.)
While the SPX tended to be in positive territory for the month at its approximate midpoint (before bearishness dominated), it’s important to remember that this line is simply a composite of the performance of 34 individual Septembers with very different outcomes. It shouldn’t be seen as evidence that sell-offs in the second half of September are inevitable. For example, from 1991-2024, the SPX posted a net gain 41% of the time (14 of 34 years) in the 10 trading days after the 11th trading day of September. But that still represents a significant departure from the index’s history of gaining ground in 60% of all 10-trading-day periods.
Finally, regardless of whether bears gain the upper hand in this particular September, there’s a bigger picture to consider. Morgan Stanley & Co. strategists—while acknowledging the reality of potential seasonal weakness, along with other risks—recently argued in favor of buying dips, if they occur. Among other factors, they maintain Fed rate cuts are not necessarily priced into the stock market, pointing out that rate-cutting cycles are typically accompanied by strong stock-market performance.2
Market Mover Update: Nvidia (NVDA) has, so far, followed through on its tendency to continue dropping after closing lower the day after releasing earnings. As of Wednesday the stock was down more than 6% since August 27 (see “Following through on the numbers”).
Wednesday marked gold’s seventh-straight up day and fourth-consecutive record close. In topping $3,500, the yellow metal fulfilled the Morgan Stanley & Co. profit target discussed in “Gold does its thing” back in April.
Today’s numbers include (all times ET): job cuts (7:30 a.m.), ADP private employment (8:15 a.m.), weekly jobless claims (8:30 a.m.), international trade in goods and services (8:30 a.m.), productivity and costs (8:30 a.m.), S&P Global Services PMI (9:45 a.m.), ISM Services Index (10 a.m.), EIA Natural Gas Report (10:30 a.m.).
Today’s earnings include: Broadcom (AVGO), Ciena (CIEN), DocuSign (DOCU), Lululemon (LULU), Phreesia (PHR), Science Applications Internation (SAIC).
Click here to log on to your account or learn more about E*TRADE's trading platforms, or follow the Company on Twitter, @ETRADE, for useful trading and investing insights.
1 All figures reflect monthly and daily S&P 500 closing prices, 1957-2024. Note: Depending on the year, “trading day 21” may represent the first trading day of October rather than the final trading day of September. Supporting document available upon request.
2 MorganStanley.com. Weekly Warm-up: Run It Hot. 8/25/25.