New faces highlight latest market push
E*TRADE from Morgan Stanley
August marked the S&P 500’s fourth-straight up month—and its third in a row with new all-time highs—but there was also a shift in market dynamics below those headlines.
While there were various storylines—earnings, Federal Reserve independence, the status of tariffs, mixed inflation signals—stock market “plot” last month arguably boiled down to weak economic news early in the month, and the Fed’s apparent response to that weakness toward the end of it.
Stocks stumbled out of the gate on August 1 after a much-weaker-than-expected monthly jobs report—a surprise that resulted in the White House firing the Bureau of Labor Statistics (BLS) commissioner. But the S&P 500 logged its best day of the month on August 22 when Fed Chairman Jerome Powell said conditions “may warrant” adjusting interest rates, although he did not commit to cutting rates this month:
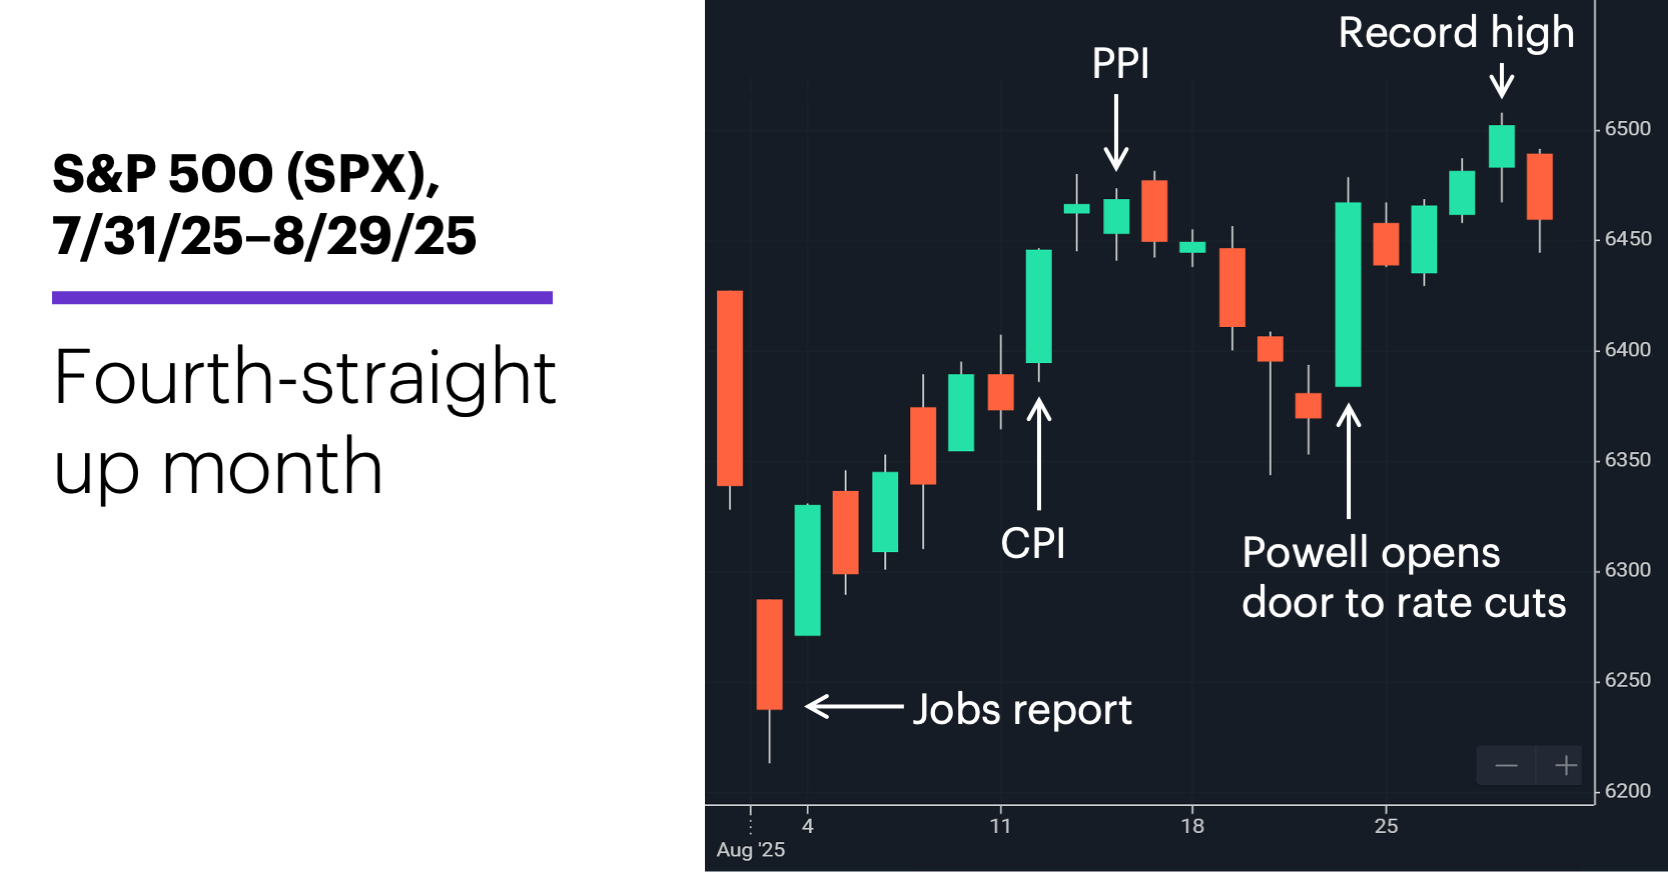
Source: Power E*TRADE. (For illustrative purposes. Not a recommendation. It is not possible to invest directly in an index.)
While a September cut is not a given, Morgan Stanley & Co. economists expect the Fed to trim interest rates by 0.25% at its upcoming meeting, eventually lowering the fed funds rate to 2.75%-3% by the end of 2026. But they also note a strong monthly jobs report this week and a “clear acceleration” in tariff-related inflation could keep the Fed on hold.1 Also, a desire to assert central bank independence, cement Chair Powell’s legacy, and commit to a data-driven framework could result in a Fed that moves more slowly on rates than some people expect, according to Morgan Stanley Wealth Management.2
Stocks shrugged off mixed inflation data. The market enjoyed one of its better days of the month on August 12 when the Consumer Price Index (CPI) came in as expected, but the S&P 500 also closed at a record high two days later when the Producer Price Index (PPI) showed hotter inflation at the wholesale level.
Market leadership changed in August. While the tech sector led the market in June and July when the S&P 500 returned to record highs after the April tariff sell-off, last month two longtime underperformers—small caps and health care—were among the biggest gainers. August was the Russell 2000 (RUT) small cap index’s strongest month since November 2024. Globally, the S&P 500 lagged developed markets, while slightly outperforming emerging markets.
Long-term yields and the US dollar declined. Bond prices mostly rose as yields declined last month, while the US Dollar Index reversed to the downside after bouncing in July.
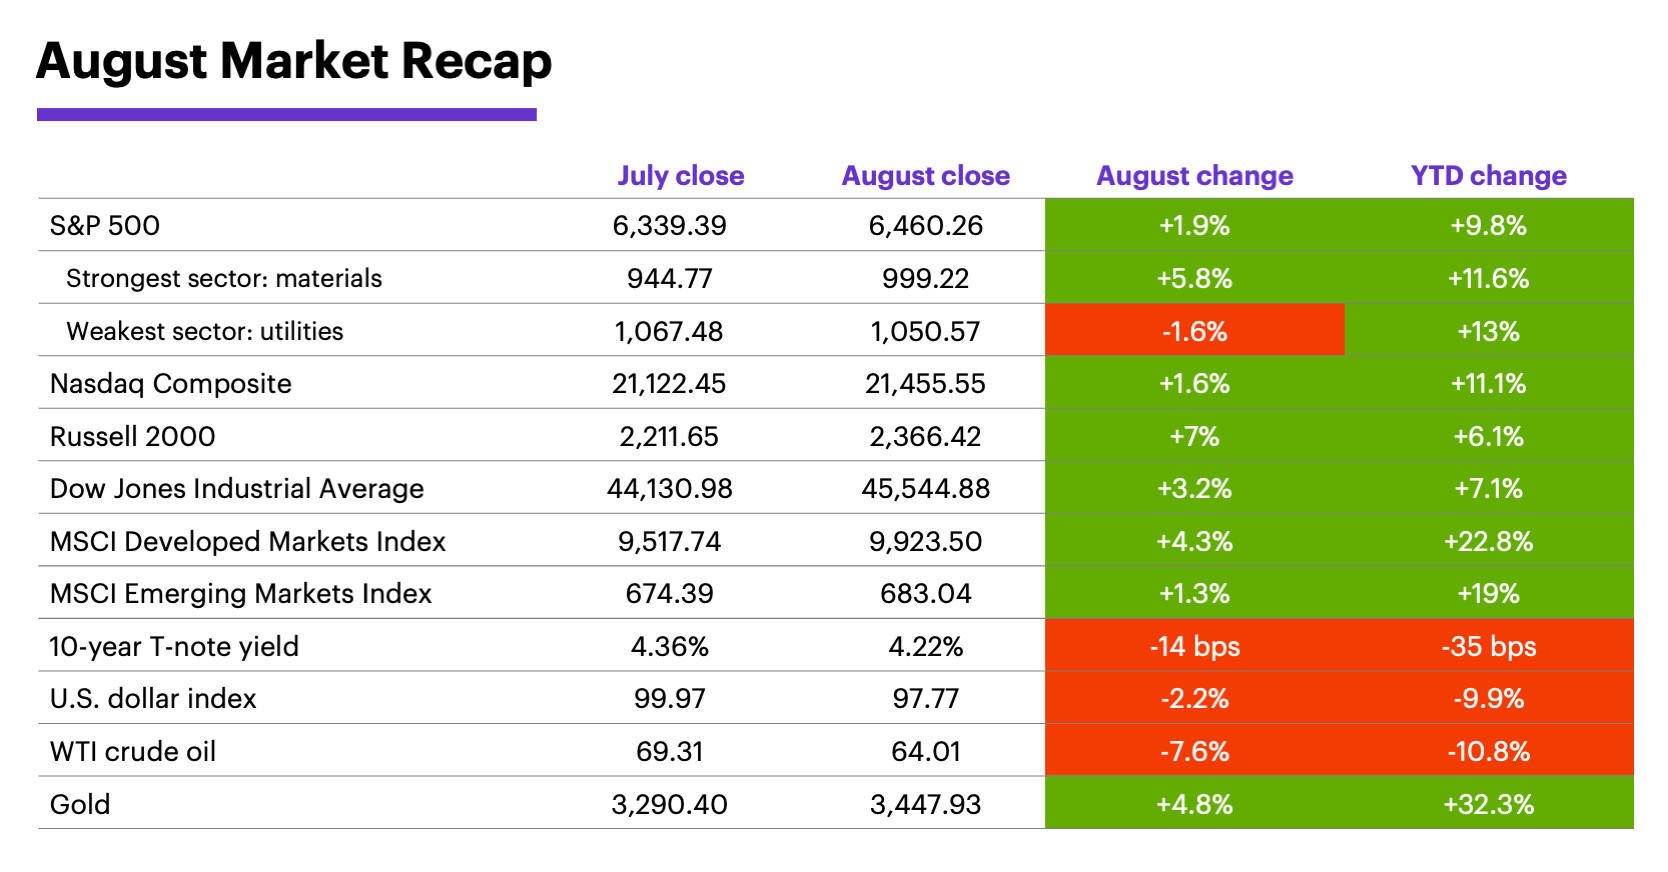
Data source: Power E*TRADE and FactSet. (For illustrative purposes. Not a recommendation. It is not possible to invest directly in an index.) Note: crude oil, gold, and U.S. Dollar Index data reflect spot-market prices. BPS (basis point) = 0.01%. MSCI Index of Developed Markets and MSCI Emerging Markets Index represent “total-return” performance (index change including dividend reinvestment).
Retail earnings mostly topped estimates, but tariffs remained a concern. For example, Walmart’s earnings announcement included raised forward guidance, but the company also noted it was working hard to keep prices low, and that tariff-impacted costs were continuing to “drift upwards.”
The S&P 500’s climb despite perceived policy headwinds has confused many market watchers, but makes more sense when viewed at the sector level, say Morgan Stanley & Co. strategists. They argue that negative policy factors (e.g., tariffs, immigration) mostly affect sectors that don’t represent a significant portion of S&P market cap, while positive policies (e.g., taxes, deregulation) benefit a broader group of stocks that contribute more to the index. They also note the “forward-looking” stock market appears to be focused on a rebounding earnings backdrop.3
Global AI capex on data centers, chips, and servers could total roughly $3 trillion through 2028.
Insight of the month: AI adoption. Morgan Stanley & Co. estimates that AI enablers and adopters represent $13-$16 trillion of potential market value creation for the S&P 500, with global AI capital expenditure of roughly $3 trillion on data centers, chips, and servers through 2028. Sectors with the highest potential value creation (relative to sector earnings power) include consumer staples distribution and retail, real estate management and development, and transportation.4
September market history. Since 1957, September is the only month with a negative average S&P 500 return. However, September has been evenly split between gains and losses since 1991, although it remained the weakest month of the year during this period. The SPX declined in seven of the past 11 Septembers, including every year from 2020-2023.5
Seasonal history aside, the back-to-school season is looking solid, according to Morgan Stanley & Co. analysts, who saw potential opportunities in various stocks amid multiple “spending tailwinds” and encouraging early datapoints.6
Market note: Morgan Stanley Wealth Management has for many months consistently advocated diversification into “real assets,” including gold.7 Although gold prices have consolidated for the past four months, they ended August at a record closing high. If 2025 had ended at that point, it would have been the first time since 2010-2011 that gold outperformed the S&P 500 two years in a row.
Key economic report dates: Employment Report (9/5), PPI (9/10), CPI (9/11), retail sales (9/16), Fed interest rate announcement (9/17), Q2 GDP, final estimate (9/25), PCE Price Index (9/26).
1 MorganStanley.com. We now forecast Fed rate cuts beginning in September. 8/25/25.
2,7 MorganStanley.com. The GIC Weekly: To Cut, or Not to Cut? 8/25/25.
3 MorganStanley.com. Explaining Equities' Resilience to Policy Risks. 8/20/25.
4 MorganStanley.com. AI Adoption and the Future of Work. 8/17/25
5 Figures reflect S&P 500 (SPX) monthly closing prices, 1957–2024. Supporting document available upon request.
6 MorganStanley.com. Back-to-School 2025—Getting High Marks. 8/27/25.
Because of their narrow focus, sector investments tend to be more volatile than investments that diversify across many sectors and companies. Technology stocks may be especially volatile. Risks applicable to companies in the energy and natural resources sectors include commodity pricing risk, supply and demand risk, depletion risk and exploration risk. Health care sector stocks are subject to government regulation, as well as government approval of products and services, which can significantly impact price and availability, and which can also be significantly affected by rapid obsolescence and patent expirations.
Yields are subject to change with economic conditions. Yield is only one factor that should be considered when making an investment decision.