Jobs take center stage
- Stocks dip for week, but close out positive August
- Small caps extend run, defensive sectors slip
- This week: jobs report, manufacturing and services data
Stocks dipped the final week of August despite hitting fresh records, as traders looked ahead to a holiday weekend—and a potentially pivotal week of economic data.
The S&P 500 (SPX) closed at all-time highs on Wednesday and Thursday, but a modest sell-off on Friday erased the week’s gain. Nonetheless, August was the fourth-straight positive month for the US market:
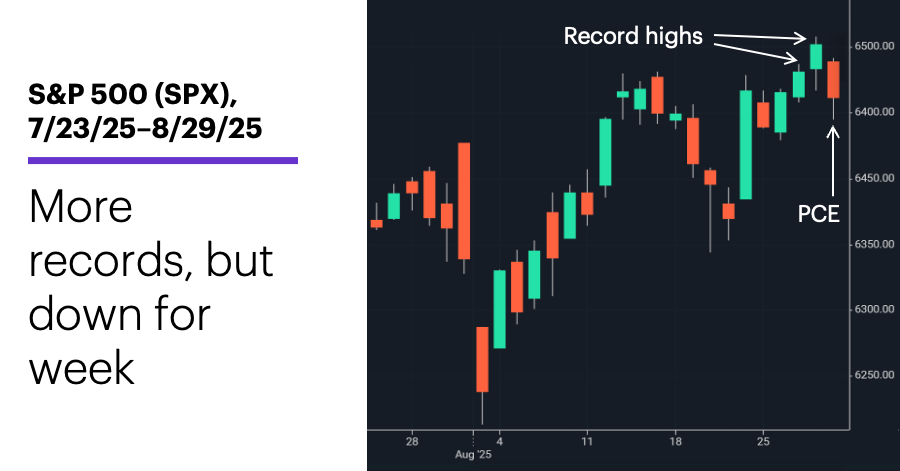
Source: Power E*TRADE. (For illustrative purposes. Not a recommendation. Note: It is not possible to invest in an index.)
The headline: Market cautious ahead of key labor-market data.
The fine print: Fed Chair Jerome Powell premised rate cuts on the idea that labor-market softness was a bigger risk than rising inflation. This week should shed light on the jobs picture. Last Friday’s in-line-with-expectations PCE Price Index reinforced the idea of sticky, but manageable inflation.
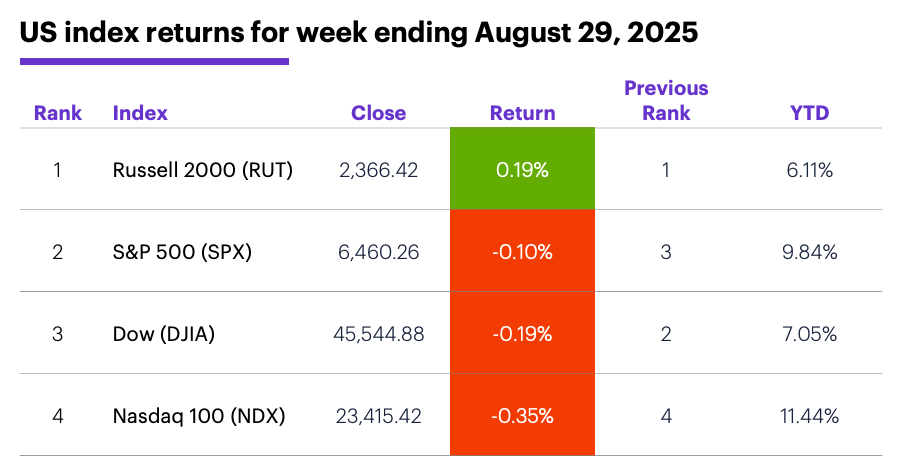
The scorecard: The Russell 2000 (RUT) small-cap index extended its recent run of relative strength:
Source (data): Power E*TRADE. (For illustrative purposes. Not a recommendation.)
Sector returns: The strongest S&P 500 sectors last week were energy (+2.3%), financials (+0.7%), and communication services (+0.6%). The weakest sectors were utilities (-2%), consumer staples (-1.7%), and industrials (-0.9%).
Stock moves: Aehr Test Systems (AEHR) +36% to $24.59 on Monday, EchoStar (SATS) +70% to $50.87 on Tuesday. On the downside, Accelerant Holdings (ARX) -26% to $21.57 and Cel-Sci (CVM) -29% to $9.31, both on Thursday. Newegg Commerce (NEGG) fell by more than 9% every day last week, shedding a total of 58% to $41.93.
Yields: The 10-year US Treasury yield fell 0.04% to 4.22% last week.
US dollar: The US Dollar Index (DXY) was little changed for the week, up 0.03 to 97.75.
Futures: October WTI crude oil (CLV5) ended an up-and-down week $0.31 higher at $63.97. Spot gold prices ended last week at a record closing high. December gold (GCZ5) rallied $97.60 to $3,516.10. Biggest rallies: October natural gas (NGV5) +7.5%, December pork cutout (PRKZ5) +6.3%. Biggest declines: September ether (ETHU5) -11.2%, September bitcoin (BTCU5) -7.5%.
Coming this week
A short, but very busy first week of September builds up to the monthly jobs report:
●Tuesday: S&P Global Manufacturing PMI, ISM Manufacturing Index, construction spending
●Wednesday: Job Openings and Labor Turnover Survey (JOLTS), factory orders, Fed beige book, auto sales
●Thursday: job cuts, ADP private employment, trade balance, productivity and labor costs, S&P Global Services PMI, ISM Services Index
●Friday: Employment Report
This week’s earnings include:
●Tuesday: Copart (CPRT), HealthEquity (HQY), Verint Systems (VRNT), Zscaler (ZS)
●Wednesday: American Eagle Outfitters Inc (AEO), C3 AI (AI), Asana (ASAN), Campbell's (CPB), Salesforce (CRM), Dollar Tree (DLTR), G-III Apparel (GIII), Hewlett Packard Enterprise (HPE), Macy's (M)
●Thursday: Broadcom (AVGO), Ciena (CIEN), DocuSign (DOCU), Lululemon (LULU), Phreesia (PHR), Science Applications Internation (SAIC)
●Friday: Core & Main (CNM)
Check the Active Trader Commentary each morning for an updated list of earnings announcements, IPOs, economic reports, and other market events.
Seasonals and small caps
Since 1957, September is the only month with a negative average S&P 500 return, even though it has been positive as often as negative over the past 34 years.
But regardless of how frequently it’s been an up or down month in a given period, September declines have often been bigger than September gains. For example, since 1991, the average September is +3.1%, while the average September decline is -4.6%. The SPX declined in seven of the past 11 Septembers, including every year from 2020 to 2023.1
Finally, last week marked the RUT’s third in a row as the strongest major US stock index. The small-cap benchmark has matched or exceeded that relative-strength milestone only 14 other times over the past decade. The RUT extended its outperformance to a fourth week only twice, in December 2023 and February 2022. It never enjoyed a fifth week at the top. (Note this is not a measure of whether the RUT’s weekly return is positive or negative, just whether it is stronger or weaker than the other indexes.)
After three weeks as the top-performing index, the RUT declined the following week nine of 14 times, with an average return of -2% for these weeks, and an average return of +1.6% for the five weeks it rallied.
Click here to log on to your account or learn more about E*TRADE's trading platforms, or follow the Company on X (Twitter), @ETRADE, for useful trading and investing insights.
1 Figures reflect S&P 500 (SPX) month price data, 1956-2025, and Russell 2000 (RUT) weekly price data, 2015-2025. Supporting document available upon request.