Fed feeds the bulls
- Fed pivot flips week from red to green
- Small caps soar, tech slump continues
- This week: Fed inflation, GDP, NVDA earnings
Before last Friday’s opening bell, the S&P 500 (SPX) was down 1.2% for the week and was coming off its lowest close in two weeks. A couple of hours later, it was in positive territory for the week and challenging its record highs.
The decisive factor was Jerome Powell’s speech at the Jackson Hole economic symposium, in which the Fed Chairman signaled the board was ready to cut interest rates amid heightened labor-market risks. The SPX jumped more than 1.7% intraday while the market-based odds of a 0.25% September cut climbed from 75% to around 83%:1
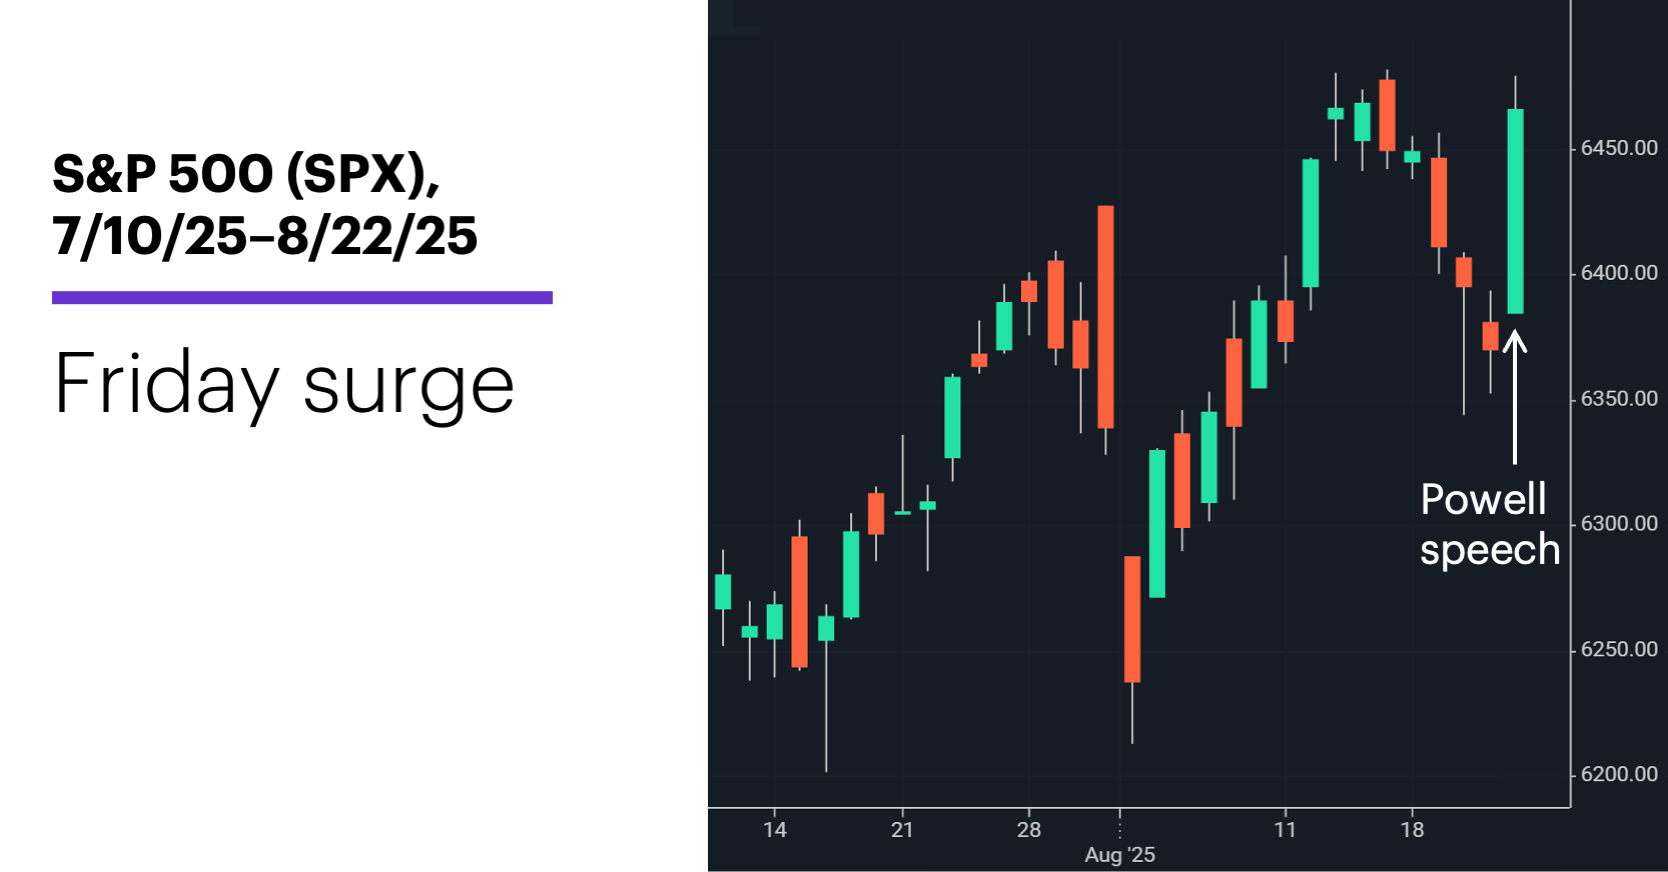
Source: Power E*TRADE. (For illustrative purposes. Not a recommendation. Note: It is not possible to invest in an index.)
The headline: Fed clears path for long-awaited rate cut.
The fine print: The debate will now turn to how far and fast the Fed will lower rates. Powell also reaffirmed the Fed’s 2% inflation target, while noting that the longer-term effects of tariffs were still uncertain. In short, he avoided declaring victory on the inflation half of the Fed’s mandate. Sidenote: Last week the White House expanded its steel and aluminum tariffs, announcing 50% duties on more than 400 additional types of products containing the metals.
The scorecard: The Russell 2000 (RUT) small-cap index was the biggest gainer on Friday and for the week. The Nasdaq 100 (NDX) tech index ended the week with a loss:
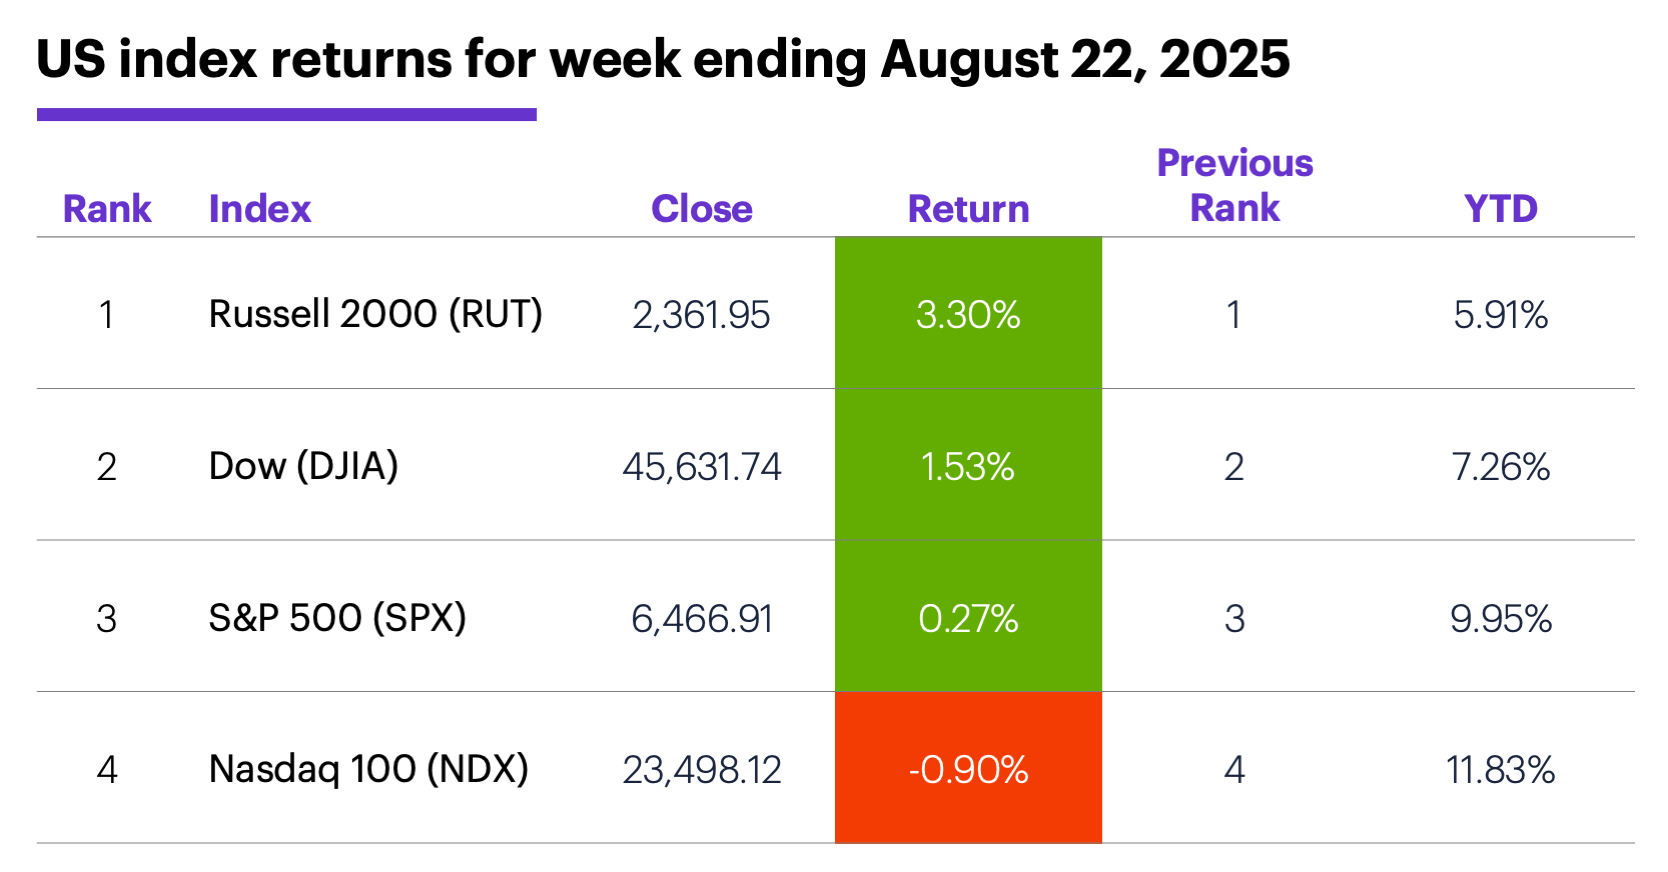
Source (data): Power E*TRADE. (For illustrative purposes. Not a recommendation.)
Sector returns: The strongest S&P 500 sectors last week were energy (+2.8%), real estate (+2.3%), and materials (+2.1%). The weakest sectors were tech (-1.6%), communication services (-1%), and consumer staples (+0.2%).
Stock moves: Plymouth Industrial REIT (PLYM) +47% to $21.53 on Tuesday, Sol-Gel Technologies (SLGL) +40% to $25.80 on Thursday. On the downside, Viking Therapeutics (VKTX) -42% to $24.36 on Tuesday, James Hardie (JHX) -34% to $18.64 on Wednesday.
Yields: The 10-year US Treasury yield fell 0.06% to 4.26% last week.
US dollar: The US Dollar Index (DXY) slipped 0.13 to 97.72 for the week, mostly because of a sharp Friday sell-off.
Futures: October WTI crude oil (CLV5) climbed $1.68 to $63.66 last week. December gold (GCZ5) climbed $35.90 to $3,418.50, but remained well within its multi-month consolidation. Biggest rallies: December coffee (KCZ5) +13.2%, August ether (ETHQ5) +9.6%. Biggest declines: November rough rice (ZRX5) -8.2%, September VIX (VXU5) -7.1%.
Coming this week
This week’s economic calendar includes the Fed’s preferred inflation gauge (PCE Price Index), the second estimate of Q2 GDP, and home price and sales data:
●Monday: Chicago Fed National Activity Index, new home sales
●Tuesday: durable goods orders, S&P Case-Shiller Home Price, FHFA House Price Index, consumer confidence
●Thursday: Q2 GDP (second estimate), pending home sales
●Friday: personal income and spending, PCE Price Index, retail and wholesale inventories (advance), Chicago PMI, consumer sentiment
Retail companies dominate the earnings calendar for a second week, but tech is also well represented—most conspicuously by NVIDIA (NVDA), which played a significant role in weighing down the sector last week:
●Monday: Nordstrom (JWN), Semtech Corp (SMTC), Trip.com (TCOM)
●Tuesday: Box (BOX), Guess (GES), Kohl’s (KSS), MongoDB (MDB), Okta (OKTA), PVH (PVH)
●Wednesday: Agilent Technologies (A), American Eagle Outfitters (AEO), Abercrombie & Fitch (ANF), Bill Holdings (BILL), Campbell's (CPB), CrowdStrike (CRWD), Five Below (FIVE), HP (HPQ), Lululemon (LULU), Nvidia (NVDA), J.M. Smucker (SJM), Snowflake (SNOW), Ulta Beauty (ULTA), Urban Outfitters (URBN)
●Thursday: Best Buy (BBY), Dell Technologies (DELL), Dollar General (DG), Dick's Sporting Goods (DKS), Gap (GAP), Hormel Foods Corp (HRL), Marvell Technology (MRVL)
●Friday: Chewy (CHWY)
Check the Active Trader Commentary each morning for an updated list of earnings announcements, IPOs, economic reports, and other market events.
The market is not the economy, and vice versa
On August 15 the SPX closed more than 27.1% above its April 4 close, marking just the eighth time over the past seven decades that the index ended a week at least 27% above the close of the 19 weeks earlier. But the index also rallied from a nearly one-year low to an all-time high in the process, a combined feat it’s never matched before.
The SPX’s persistent push to new highs despite signs of an economic slowdown and continued policy uncertainty—most significantly, from tariffs—has led to discussions about a potential disconnect between the economy and the market.
Morgan Stanley & Co. analysts recently weighed in on the topic, arguing that the market’s recent performance makes more sense when viewed at the sector level: While the negative impacts of tariffs and immigration policy are concentrated in sectors that don’t represent a significant portion of the SPX’s market cap, tailwinds in the form of tax policy and deregulation benefit a wider group of companies that are driving performance at the index level.2
Click here to log on to your account or learn more about E*TRADE's trading platforms, or follow the Company on X (Twitter), @ETRADE, for useful trading and investing insights.
1 CMEGroup.com. FedWatch Tool. 8/22/25.
2 MorganStanley.com. Explaining Equities' Resilience to Policy Risks. 8/20/25.