Market breaks range bottom
- Oil prices, geopolitics continue to pressure stocks
- Russell 2000 in correction, gold and other metals slide
- This week: energy prices, consumer sentiment
The US stock market has been mostly rangebound since late October, but after four-straight weeks of losses—capped by a sharp Friday sell-off—it was challenging the boundary between consolidation and downturn.
The S&P 500 (SPX) opened last week with a two-day rally, but with oil prices remaining elevated amid strikes on Iran’s energy infrastructure—and Iranian counterattacks on its Middle Eastern neighbors and ships in the Strait of Hormuz—the market hit fresh lows rest of the week.
The downturn started last Wednesday as the Producer Price Index (PPI) delivered a higher-than-expected inflation reading and the Federal Reserve announced it was leaving interest rates unchanged—citing uncertainty about the economic impact of higher energy prices. At Friday’s low, the SPX was down more than 7% from its January high, and had fallen to its lowest level since last September:
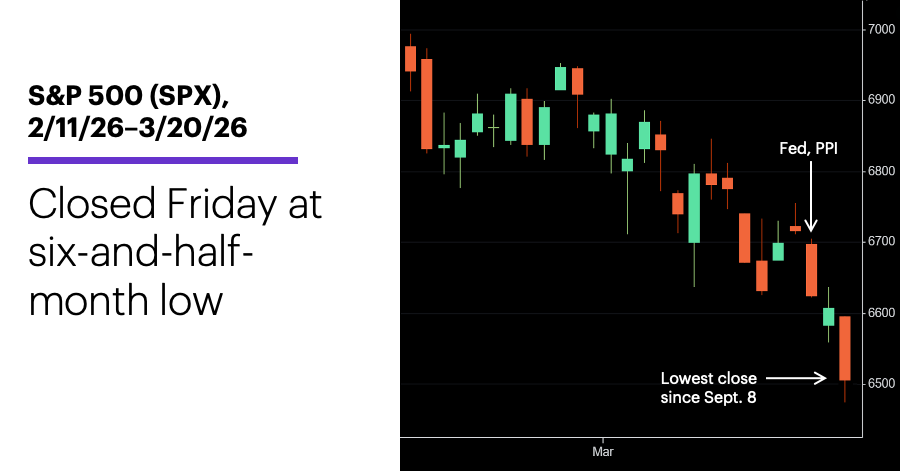
Source: Power E*TRADE. (For illustrative purposes. Not a recommendation. Note: It is not possible to invest in an index.)
The headline: S&P 500 punctures consolidation as Iran war continues.
The fine print: While the SPX closed last week at its lowest level in more than six months, there were few signs of panic selling. One perspective: This underscores the market’s resilience. The alternate take: The market may need a clearer, sharper “selling climax” to signal the pullback has potentially run its course. The market woke up to some potentially good news out of the Middle East on Monday, but follow-through on any relief rally will likely require tangible follow-through on the geopolitical front.
The number: 4. Friday marked the first time the SPX posted four consecutive down weeks since March 2025.
The scorecard: The Russell 2000 (RUT) small-cap index has the second-smallest year-to-date loss, but it is the first major index to hit correction territory, closing Friday more than 10% below its January 22 record close:
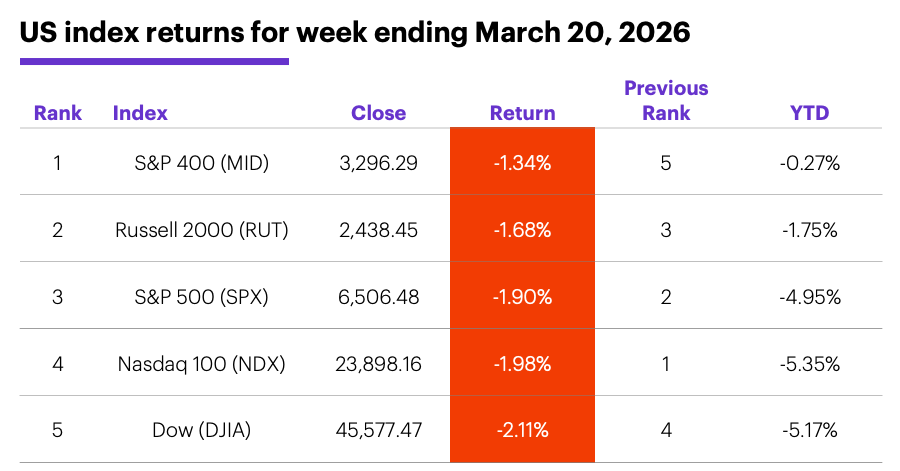
Source (data): Power E*TRADE. (For illustrative purposes. Not a recommendation.)
Sector returns: The strongest S&P 500 sectors last week were energy (+3%), financials (+0.4%), and communication services (-1.6%). The weakest sectors were utilities (-4.9%), materials (-4.6%), and consumer staples (-4.5%).
Stock moves: Distribution Solutions (DSGR) +35% to $26.07 and National Storage Affiliates (NSA) +30% to $40.23, both on Monday. Better Home & Finance (BETR) -17% to $28.70 on Monday, Super Micro Computer (SMCI) -33% to $20.53 on Friday.
Yields and the dollar: The 10-year US Treasury yield jumped 0.11% to 4.39% last week—its highest level since last July. The US Dollar Index (DXY) fell 0.71 to 99.65 in a mostly rangebound week.
Commodity futures: Last Monday crude oil fell 5% to $93.23, but had trouble holding below $95 the rest of the week. May WTI crude oil (CLK6) closed Friday at $98.23, up $1.39 for the week. With the Fed’s pause cementing higher-for-longer interest rates, April gold (GCJ6) tumbled $489.80 (-9.6%) to $4,574.90, the market’s biggest one-week decline since 2011. Biggest gains: May heating oil (HOK6) +13.8%, May sugar (SBK6) +9.3%. Biggest declines: May orange juice (OJK6) -19%, May silver (SIK6) -14.4%.
Crypto: Bitcoin hit a six-week high last Tuesday before ending the week down 0.7% at $70,746.73. Ethereum had a similar early-week bump before pulling back, climbing +2.8% to $2,156.56 for the week.
Coming this week
This week’s relatively low-profile economic calendar will likely keep the spotlight on oil prices and geopolitics, although the weekly EIA oil and gas reports may get a little more attention than usual:
●Monday: Chicago Fed National Activity Index, Construction Spending (Jan., delayed)
●Tuesday: Productivity and Labor Costs (revised), S&P Global Manufacturing and Services PMIs (flash)
●Wednesday: Current Account (Q4), Import Price Index, EIA Petroleum Status Report
●Thursday: Initial Jobless Claims, EIA Natural Gas Report
●Friday: Consumer Sentiment (final)
This week’s earnings include:
●Monday: Core & Main (CNM)
●Tuesday: Cintas (CTAS), KB Home (KBH), Lands' End (LE), Verint Systems (VRNT)
●Wednesday: Paychex (PAYX), Winnebago (WGO), Worthington Enterprises (WOR)
●Thursday: Shoe Carnival (SCVL)
●Friday: Legence (LGN)
Longer-term VIX picture
Last week was the first time since 2022—and only the 16th time since 1990—that the S&P 500 (SPX) and the Cboe Volatility Index (VIX) both closed lower two weeks in a row.
As discussed here last week, the VIX typically rallies when the SPX declines—especially when it sells off sharply, reflecting expectations for increased future market volatility. If the VIX falls along with the SPX, it means the VIX is signaling lower future volatility despite falling stock prices—a recipe for a potential market rebound. For example, following the daily SPX-VIX signals that occurred on March 12-13, the SPX bounced for two days before pulling back.
When the SPX and VIX both closed lower two weeks in a row, the market tended to rebound over the next several weeks—but not necessarily immediately. Keeping in mind that the SPX’s four-, eight-, and 12-week median returns since 1990 are 1.2%, 2%, and 2.9%, respectively:
1. The SPX closed lower the next week eight of 15 times.
2. The SPX was higher four weeks later 11 of 15 times, with a median gain of 2.7%.
3. The SPX was higher eight weeks later 12 of 15 times, with a median gain of 4.6%.
4. The SPX was higher 12 weeks later 14 of 15 times, with a median gain of 5.8%.
However, as last week showed, during periods of geopolitical stress, headlines can overwhelm technical price tendencies that may otherwise play out in “normal” market conditions.
Finally, the SPX has followed a positive week with four consecutive down weeks—while also ending the fourth week at its lowest weekly close in at least 27 weeks—24 other times since 1957. In 13 cases (54% of the time), the index closed lower the following week.1
Click here to log on to your account or learn more about E*TRADE's trading platforms, or follow the Company on X (Twitter), @ETRADE, for useful trading and investing insights.
1 All figures reflect S&P 500 (SPX) and Cboe Volatility Index (VIX) weekly closing prices, 1990-2026. Supporting document available upon request.