June stock market patterns
- S&P 500 up in eight of past 10 Junes
- Longer-term history more mixed
- Typical positive June returns are smaller than average
With the US stock market in position to deliver one of its strongest May returns of the past quarter century, attention will now turn to a month with a less-bullish historical track record.
From a seasonal perspective, the S&P 500’s (SPX) 0.06% average June return since 1957—the second-weakest of all months—may not inspire confidence the market will be able to build on its gains in the near future. On the other hand, June has been an up month in 12 of the past 20 years and eight of the past 10:1
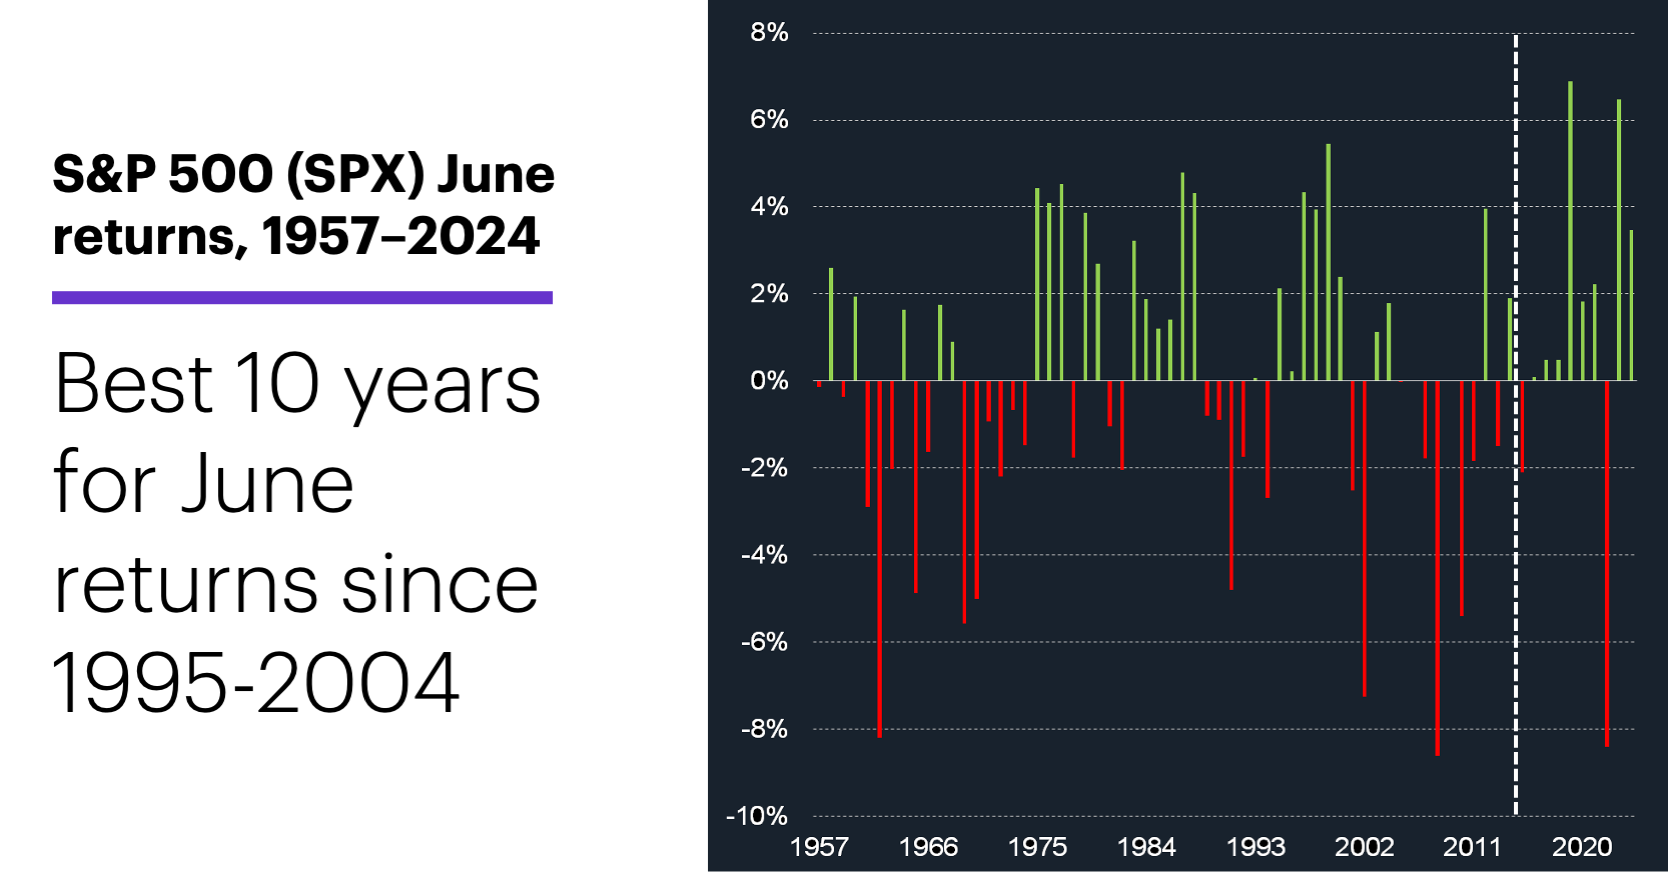
Source (data): Power E*TRADE. (For illustrative purposes. Not a recommendation. Note: It is not possible to invest directly in an index.)
From 1957-1990, June was positive 16 times and negative 18, although the average gain (+2.8%) was bigger than the average loss (-2.4%).
Those basic characteristics reversed from 1991-2024: June was more frequently an up month (21 out of 34 years), but its average loss (-3.7%) was bigger than its average gain (+2.4%). Five positive Junes during this period had returns of +0.23% or less, while five negative Junes had returns exceeding -4.5%.
Of course, a question on many minds is whether May’s outperformance makes it more or less likely that June will exhibit its historical softness. Aside from the reality that seasonal tendencies always take a back seat to “developments on the ground,” that’s a difficult question to answer, since so few May returns have been as strong as this one. After the six other times the SPX rallied 5% or more in May (the last time was in 2009), June was positive five times, with a 1.2% median return—slightly higher than the 1% median return for all months since 1957.
If we take May out of the equation and simply look at the 86 other times the SPX rallied at least 5% while also closing at a two-month (or longer) high, we still see net-positive performance: The index closed higher the next month 67% of the time, with a median return of 1%. That said, the eight instances that more closely mirror the current one—a 5% monthly gain, and a monthly closing price that is higher than the previous two but lower than three months ago—had less-bullish follow-through: The SPX closed higher 63% of the time, with a 0.3% median return.
Market Mover Update: With crude oil prices continuing to consolidate, energy is poised to wrap up the week—and the month—as one of the weakest S&P 500 sectors (see “Energy seeks traction”).
Cinemark (CNK) slipped for a second day since challenging its February highs (see “Options highlighting momentum shift?”).
While NVIDIA (NVDA) posted a solid (if unspectacular) rally on Thursday after releasing earnings, a stock that recently surged after announcing a deal with NVDA sold off. Navitas Semiconductor (NVTS), which more than tripled in price in the days following news on May 22 that it would provide NVDA with “energy architecture” solutions, fell 12.5%:
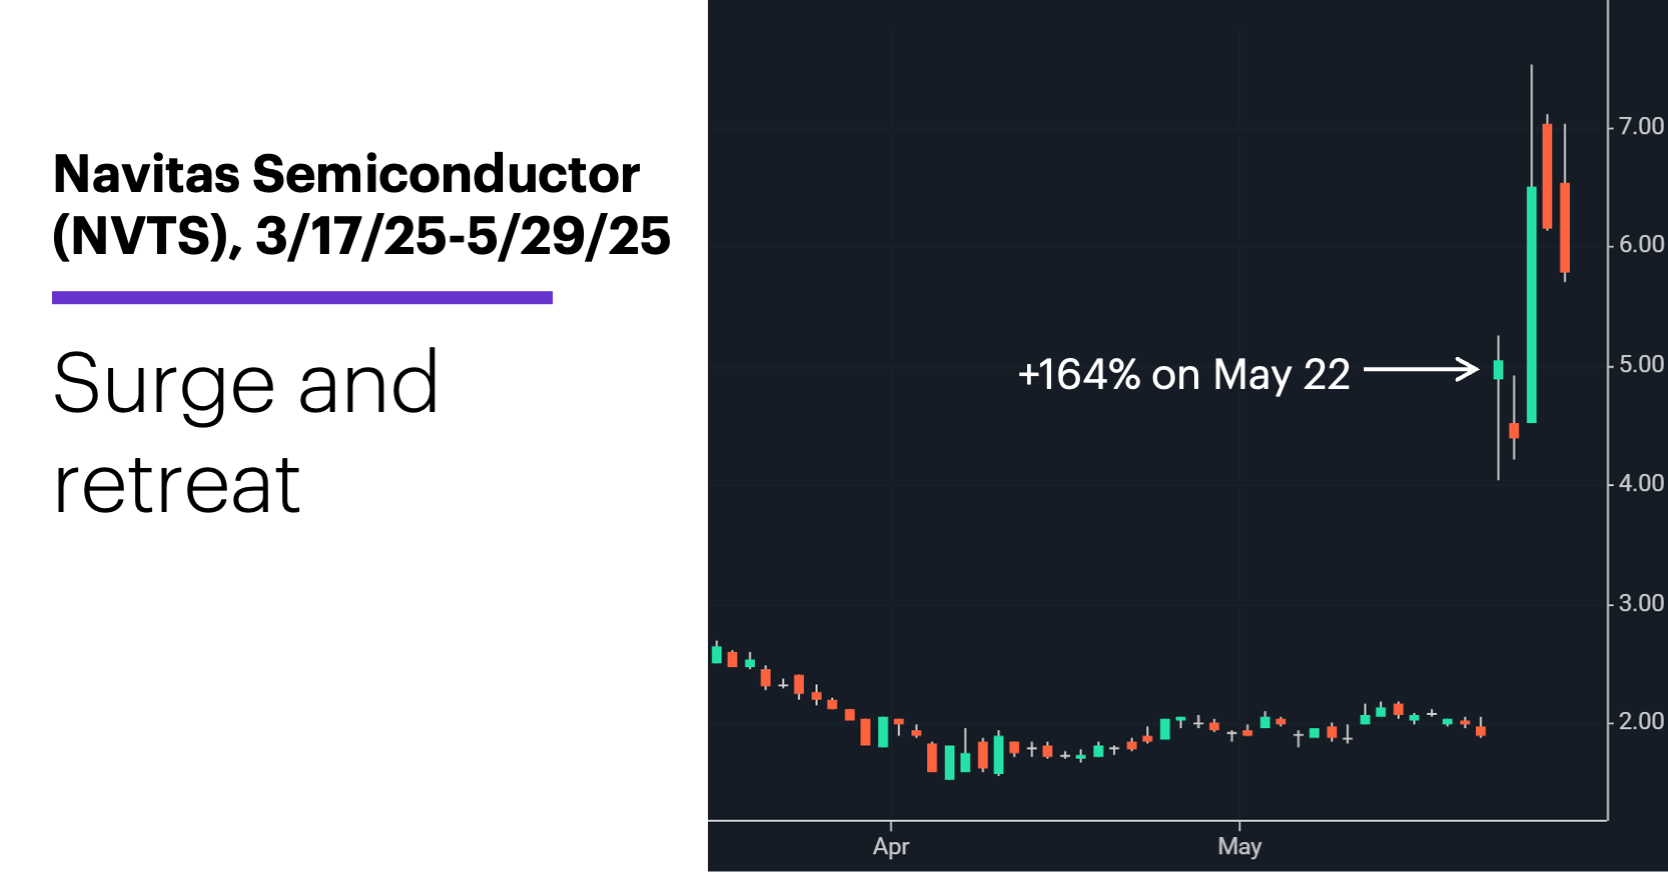
Source: Power E*TRADE. (For illustrative purposes. Not a recommendation.)
NVTS was also on top of the LiveAction scan for heavy call options volume on Thursday, but as was the case with CNK earlier this week, it appeared to be possible that traders were exiting positions rather than opening new ones.
Today’s numbers include (all times ET): advance international trade in goods (8:30 a.m.), personal income and spending (8:30 a.m.), PCE Price Index (8:30 a.m.), advance retail and wholesale Inventories (8:30 a.m.), Chicago PMI (9:45 a.m.), consumer sentiment (10 a.m.).
Today’s earnings include: Immunovant (IMVT), Shoe Carnival (SCVL).
Click here to log on to your account or learn more about E*TRADE's trading platforms, or follow the Company on Twitter, @ETRADE, for useful trading and investing insights.
1 All figures reflect S&P 500 (SPX) monthly prices, 1957–May 2024. Supporting document available upon request.