New market storyline emerges
- Stocks pressured as Treasury yields hit three-month highs
- Debt and deficits in focus as House passes spending bill
- This week: Fed inflation, retail earnings, NVDA earnings, GDP
Wall Street has spent much of the past three months reacting to news out of Washington. That didn’t change last week, although the nature of the news was a little different this time around.
Stocks pulled back not because of another twist in the tariff story, but amid concerns about the sustainability of fiscal policy as the House of Representatives passed a tax and spending bill estimated to add trillions of dollars to the US debt.1
Despite closing less than 3% below its all-time high last Monday after the US credit rating received a downgrade from Moody’s, the S&P 500 (SPX) retreated the rest of the week—most sharply on Wednesday—as Treasury yields climbed to their highest levels in more than three months:
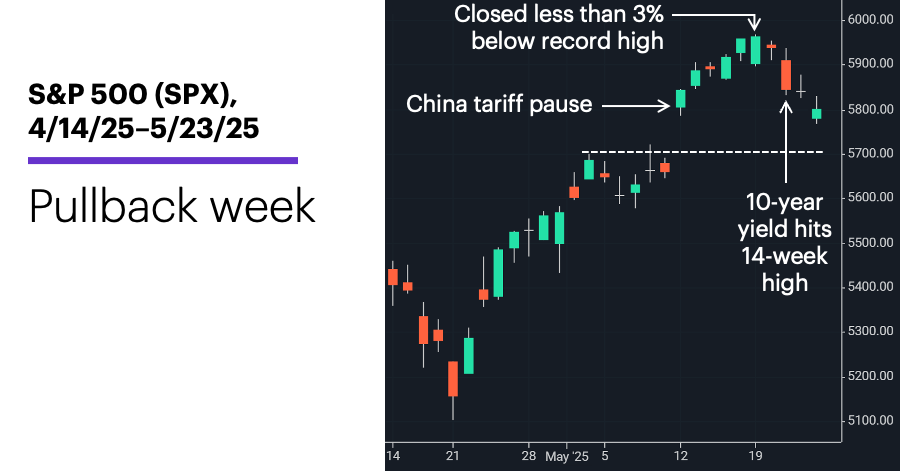
Source: Power E*TRADE. (For illustrative purposes. Not a recommendation. Note: It is not possible to invest in an index.)
The headline: Market pulls back as debts and deficits take center stage.
The fine print: While the SPX fell more last week than it has in any other since the early-April tariff rout, it gave back only around half of the prior week’s 5.3% rally, and was still up more than 4% for the month as of Friday. That said, some traders may be eyeing a possible test of the early-May highs, which the index broke out above after news of the US-China tariff pause. (Tariffs made another splash late last week as the White House threatened tariffs against Apple and the European Union, then "paused" the latter over the weekend.)
The scorecard: The Russell 2000 (RUT) small-cap index suffered the sharpest loss last week:
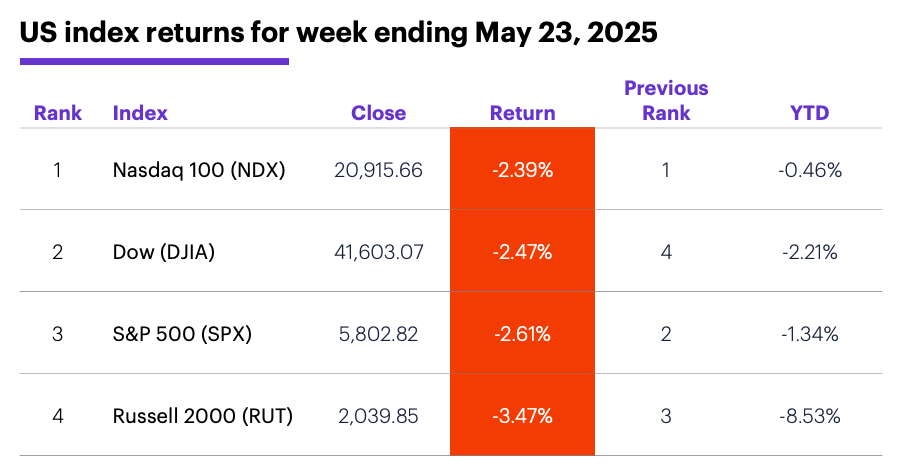
Source (data): Power E*TRADE. (For illustrative purposes. Not a recommendation.)
Sector returns: The strongest S&P 500 sectors last week were consumer staples (-0.4%), communication services (-0.7%), and materials (-1.2%). The weakest sectors were energy (-4.4%), tech (-3.5%), and real estate (-3.3%).
Stock moves: Advance Auto Parts (AAP) +57% to $49.17 and IonQ (IONQ) +37% to $45.79, both on Thursday. On the downside, SolarEdge Technologies (SEDG) -25% to $14.95 and Enphase Energy (ENPH) -20% to $38, also on Thursday.
Yields: Last Wednesday the benchmark 10-year Treasury yield closed at its highest level (4.59%) since February 12, ending the week up 0.07% at 4.51%.
US dollar: The US Dollar Index (DXY) fell 1.99 to 99.10 last week.
Futures: June gold (GCM5) rallied $178.50 last week, closing Friday at a two-week high of $3,365.80. July WTI crude oil (CLN5) continued to hit resistance at a former breakdown level, ending a congested week down $0.44 at $61.53. Biggest up moves: June VIX (VXM5) +13.3%, July platinum (PLN5) +10.1%. Biggest down moves: July cocoa (CCN5) -10.4%, June E-Mini S&P Midcap (EMDM5) -3.8%.
Coming this week
Fed inflation (the PCE Price Index) will provide another snapshot of inflation, while durable goods orders may shed light on whether consumers have continued to make big-ticket purchases:
●Tuesday: durable goods orders, S&P Case-Shiller Home Price, NAHB House Price Index, consumer confidence
●Wednesday: FOMC minutes
●Thursday: Q1 GDP (second estimate), pending home sales
●Friday: personal income and spending, PCE Price Index, trade balance in goods (advance), retail and wholesale inventories (advance), Chicago PMI, consumer sentiment
This week’s earnings calendar features more retail and more tech—most prominently, Nvidia (NVDA):
●Tuesday: Box (BOX), Chewy (CHWY), Okta (OKTA), Semtech Corp (SMTC)
●Wednesday: Agilent Technologies (A), C3 AI (AI), Abercrombie & Fitch (ANF), Salesforce (CRM), E.L.F. Beauty (ELF), Guess (GES)
●Thursday: American Eagle Outfitters (AEO), Best Buy (BBY), Burlington Stores (BURL), Dell Technologies (DELL), Gap (GAP), Kohl’s (KSS), Marvell Technology (MRVL), UiPath (PATH), Ulta Beauty (ULTA), Zscaler (ZS), Nvidia (NVDA)
●Friday: Immunovant (IMVT), Shoe Carnival (SCVL)
Check the Active Trader Commentary each morning for an updated list of earnings announcements, IPOs, economic reports, and other market events.
Post-Memorial Day stock-market pattern
The four-day trading week after Memorial Day has tended to be more bullish than average for stocks since 1971, when it became a fixed Federal holiday on the last Monday in May.
While the SPX had a positive return in 56% in all four-day periods from May 1971–May 2024 (with an average return of 0.14%), it had a positive return in 61% of the four-day periods following Memorial Day, with an average gain of 0.5%:2
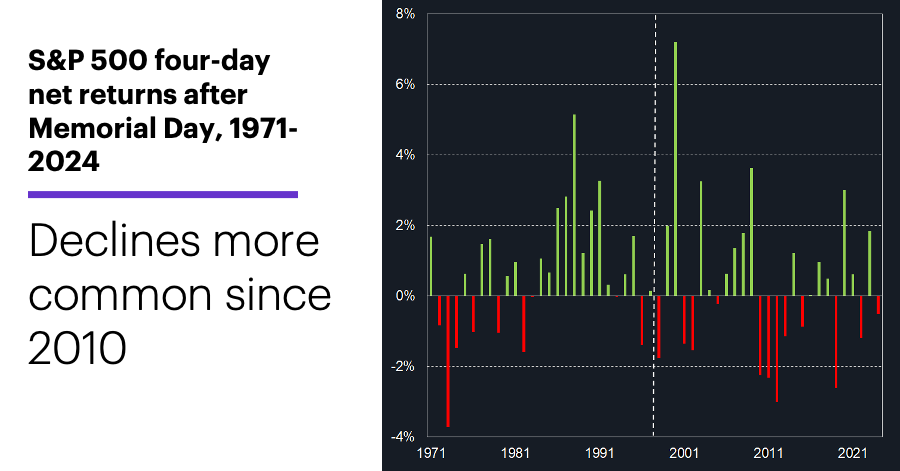
Data source: Power E*TRADE. (For illustrative purposes. Not a recommendation. Note: It is not possible to invest directly in an index.)
However, over the most recent 27 years, and especially since 2010, declines have been more common—and, on average, larger. From 1971-1997 the SPX gained ground in the four days after Memorial Day in 18 of 27 years, with an average return of 0.7%. But from 1998-2024, the SPX rallied during this period in just 15 of 27 years, with average return of 0.3%. Since 2010, the SPX has posted a net decline in the shortened week eight times and a net gain seven times.
Click here to log on to your account or learn more about E*TRADE's trading platforms, or follow the Company on X (Twitter), @ETRADE, for useful trading and investing insights.
1 Reuters. US House narrowly passes Trump's sweeping tax-cut bill, sends on to Senate. 5/22/25.
2 All figures represent S&P 500 (SPX) daily closing prices, 1971-2024. Supporting document available upon request.