May stock market patterns
- May a positive month for SPX 63% of the time since 1957
- Notably more bullish for stocks in recent decades
- Mixed results after negative March-April
With the caveat that we remain in an exceptional market environment revolving mostly around the tariff story, it’s time to take a step back and look at how the market has typically performed around this time of the year.
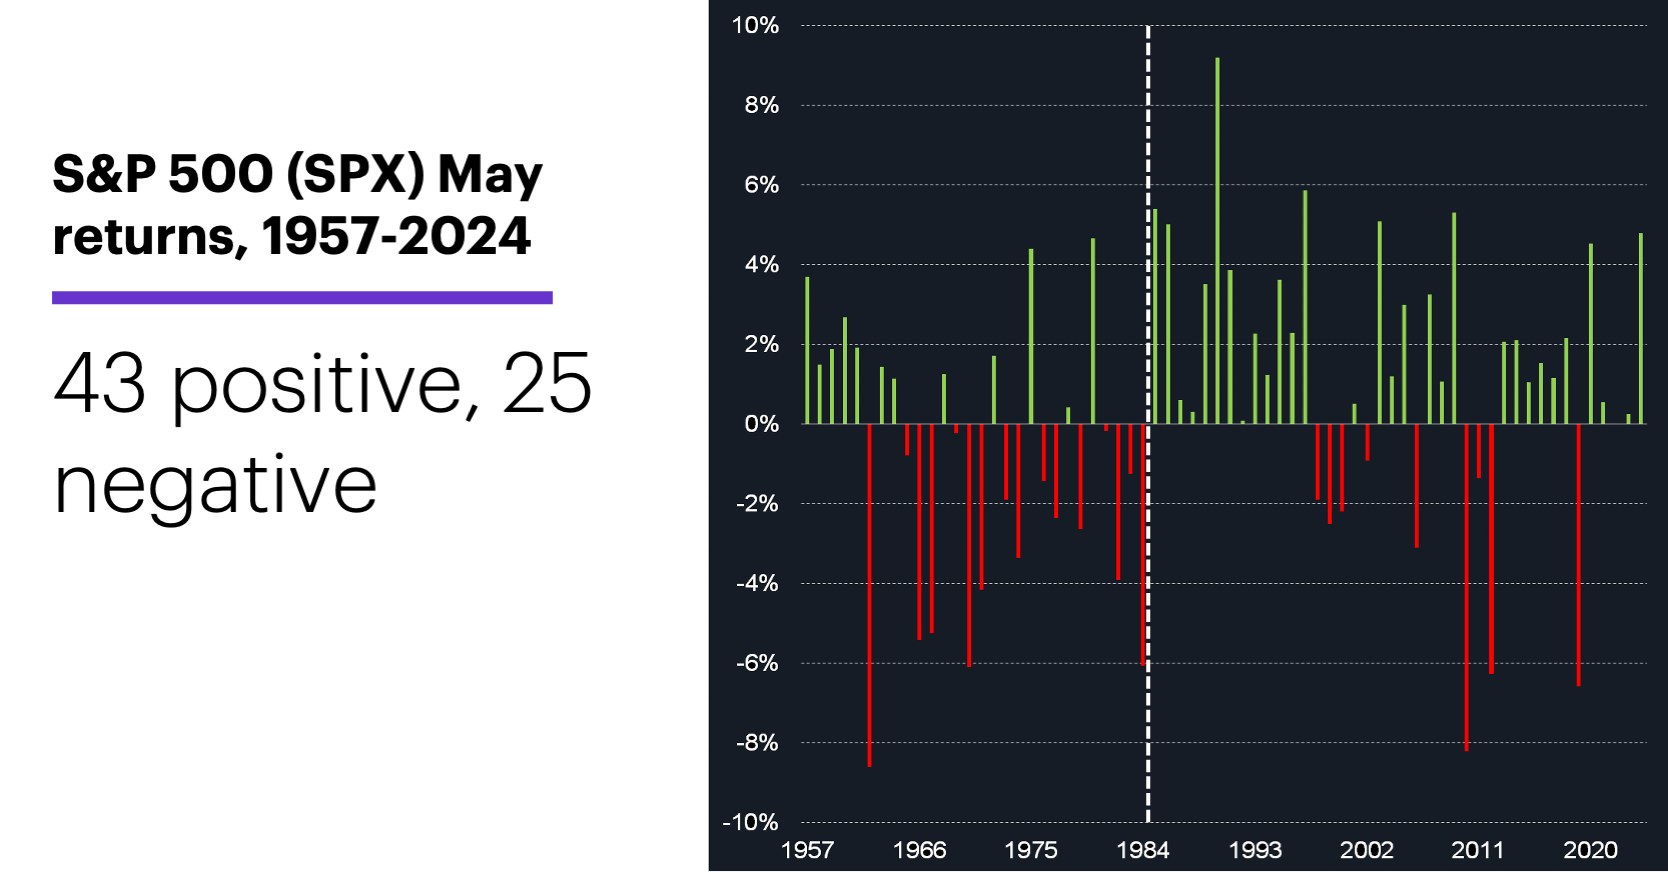
May was positive for the S&P 500 (SPX) in 43 of the past 68 years—63.24% of the time, the fifth-highest percentage among all months during that span. The other side of the coin is that May’s 1.1% median return since 1957 is smaller than that of all but three other months:
Source: Power E*TRADE. (For illustrative purposes. Not a recommendation. Note: It is not possible to invest directly in an index.)
However, there’s a significant difference between the first 28 years on this chart and the 40 that followed (dashed line). From 1957–1984, May was a negative month four more times than it was a positive one (16 vs. 12), no doubt fueling the long-time admonition to “sell in May and go away.” Since 1985, though, May has been positive 77.5% of the time (31 of 40 years), more often than any other month. That impressive stat owes much to a 13-year run of uninterrupted May gains from 1985 through 1997.1
Still, even during this four-decade stretch, May’s 1.2% median return was only the seventh-strongest of all months.
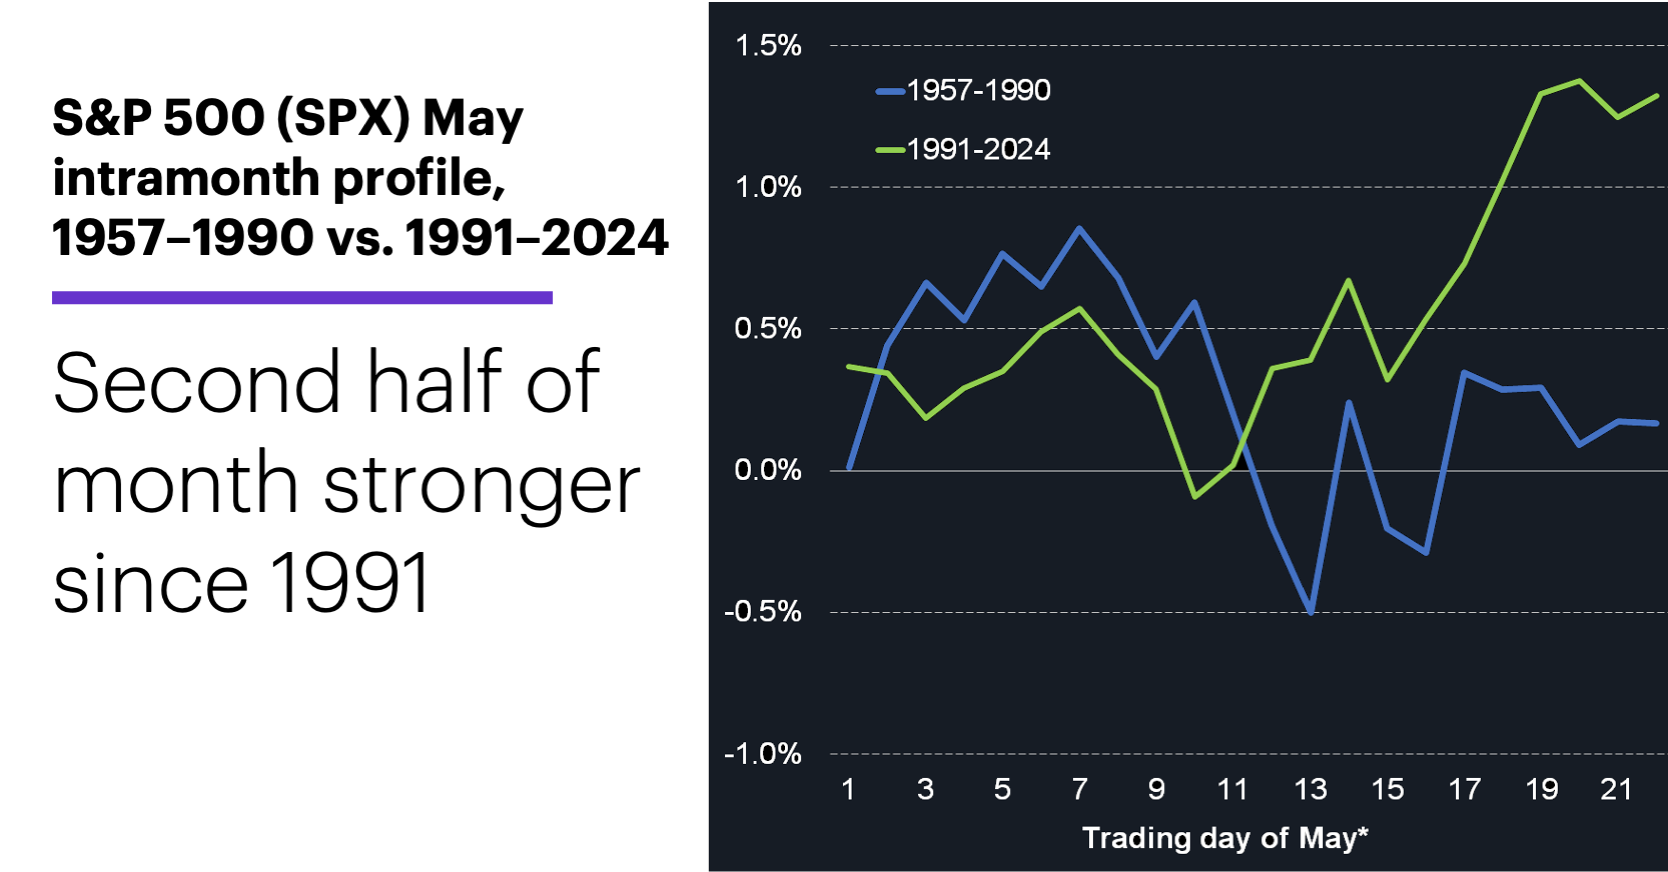
The following chart shows the SPX’s “typical” path throughout May—the median return measured from the last trading day of April to each of the next 22 trading days. It compares these intramonth return profiles for two periods, 1957-1990 (blue) and 1991-2024 (green):
Source: Power E*TRADE. (For illustrative purposes. Not a recommendation. Note: It is not possible to invest directly in an index. Depending on the month, trading day 22 may be the last trading day of May or the first trading day of June.)
During the most recent 34 years, the SPX’s median monthly return has not only been larger, but those gains have tended to accumulate in the latter half of the month.
Finally, there have been only two other times since 1957 that the SPX fell in February, March, and April—1973 and 1974. In both cases, the index also fell in May. There have been seven times the SPX declined in both March and April (add 1960, 1962, 1985, 2004, and 2005). May was a positive month in four of those years. And if we just look at the 26 times the SPX was in negative territory for the year at the end of April, May was a positive month 14 times.
Market Mover Update: Tuesday marked the first day that the SPX traded entirely outside the April 7’s high-low range (see “Record day for stocks”). June WTI crude oil futures (CLM5) fell more than 2% on Tuesday, closing at a two-week low of $60.42 (see “Slippery oil picture”).
The week’s first labor market data came in weaker than expected on Tuesday. Job openings for March were 7.19 million, the second-lowest reading of the past four years.
Today’s numbers include (all times ET): mortgage applications (7 a.m.), ADP Private Employment Report (8:15 a.m.), GDP (8:30 a.m.), Chicago PMI (9:45 a.m.), Personal Income and Spending (10 a.m.), PCE Price Index (10 a.m.), Pending Home Sales Index (10 a.m.), EIA Petroleum Status Report (10:30 a.m.).
Today’s earnings include: Automatic Data Processing (ADP), Caterpillar (CAT), Vulcan Materials (VMC), Yum Brands (YUM), Albemarle (ALB), eBay (EBAY), Meta (META), Microsoft (MSFT), Qualcomm (QCOM)
Click here to log on to your account or learn more about E*TRADE's trading platforms, or follow the Company on Twitter, @ETRADE, for useful trading and investing insights.
1 All figures reflect S&P 500 (SPX) monthly closing prices, 1957-2024. Supporting document available upon request.