Looking for post-earnings traction
- TSCO down more than 10% after earnings
- Shares closed at lowest price since Nov. 2023
- Similar moves highlight continued volatility
Earnings season inevitably focuses on what is about to happen—whether a company will beat or miss its numbers, by how much, and how its stock may react. A day later, that story is “stale,” and another ticker on the earnings calendar becomes the focal point of a new round of forecasts.
Although a market’s initial reaction to any event isn’t necessarily “correct,” one example highlights the potential insights that can be gleaned from taking a deeper dive into what happens after an earnings announcement. Traders who have followed Tractor Supply (TSCO) in recent months may not have batted an eye at the rural retailer’s post-earnings drop on Tuesday. The stock was already 28.5% below last August’s record high when Wednesday’s 11.7% sell-off dopped it to its lowest level since November 2023:
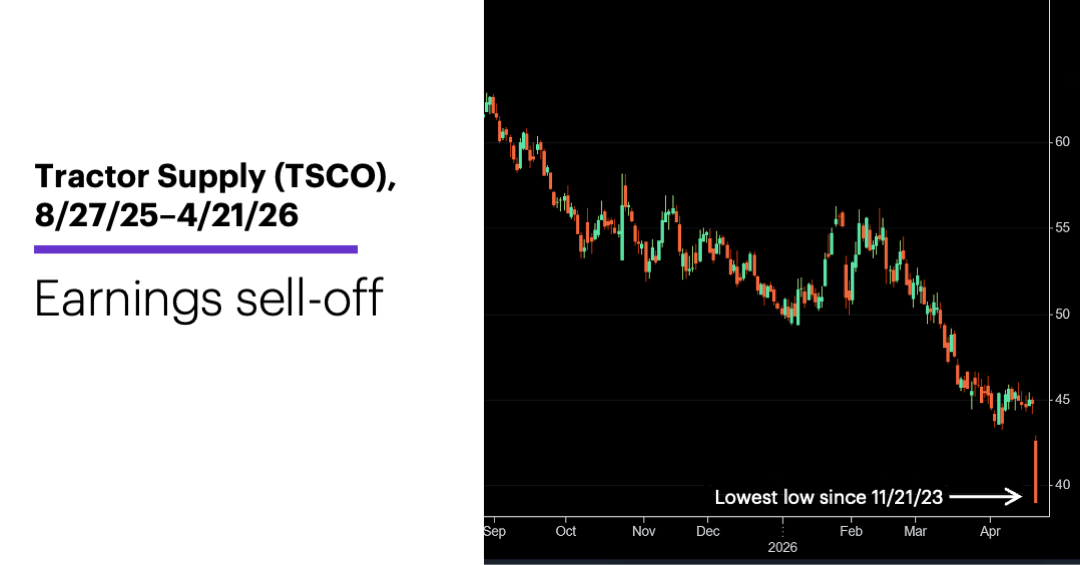
Source: Power E*TRADE. (For illustrative purposes. Not a recommendation.)
The company missed its headline earnings and revenue numbers, and its forward guidance was in the middle of the expected range. So, where did the stock’s initial reaction fit in on a historical basis?
To provide some perspective, TSCO has closed down 10% or more in a day while also hitting its lowest level in at least a year only seven other times since 1994. Ten-percent-or-larger down days that only dropped the stock to its lowest close in three or more months were slightly more common, occurring 13 times over the past 32 years. And an even more modest 7.5%-or-larger decline (to a three-month-or-longer low) produced 27 examples.
That said, these variations on a theme have something in common: As a group, they tended to be followed by volatile price movement over the next month or so, alternating between weekly (five-trading-day) gains and losses. For example, after the 27 times TSCO had a 7.5%-or-larger down day and closed at its lowest level in at least three months, the stock:
1. posted a net gain over the next five trading days later 14 times (52%).
2. posted a net loss five to 10 trading days later 17 times (63%).
3. posted a net gain 10 to 15 trading days later 16 times (59%).
4. posted a net loss 15 to 20 trading days later 16 times (59%).
5. posted a net gain for the entire 20-trading-day period 16 times (59%), with a median return of 5.3%.1
Despite the volatility from one five-day period to the next, though, TSCO’s 20-day median return of 5.3% after the large down days is much higher than its 1% median return for all 20-day periods since 1994. And while put options volume was running approximately 20 times average on Tuesday (compared to 10 times average for call options), most of the activity appeared to be traders getting out of existing position in the April options expiring on Friday, rather than establishing new positions that could potentially represent bearish positions on the stock.
A longer-term chart shows TSCO still approximately 6% above a potential “support zone” defined by its 2022-2023 lows (roughly $33-$37):
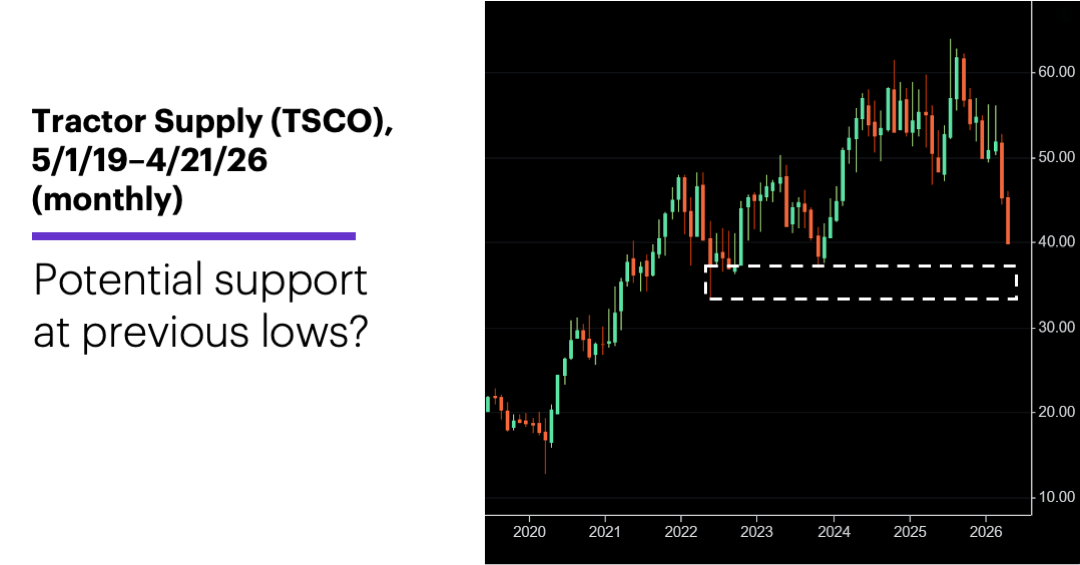
Source: Power E*TRADE. (For illustrative purposes. Not a recommendation.)
Many traders and investors seek a level of certainty—unequivocal trend confirmation or reversal signals—that markets never provide. Price moves always look different depending on context and time frame. From a short-term perspective, for example, TSCO’s recent price action may seem to suggest its recent downtrend is gaining momentum. A trader or investor with a longer-term view may consider the sell-off as a potential adjustment to a more attractive level—with the caveat that the historical record still points to additional short-term volatility.
Today’s numbers include (all times ET): mortgage applications (7 a.m.), Atlanta Fed Business Inflation Expectations (10 a.m.), EIA Petroleum Status Report (10:30 a.m.).
Today’s earnings include: Boeing (BA), CME Group (CME), GE Vernova (GEV), Lam Research (LRCX), Medpace (MEDP), ServiceNow (NOW), Otis Worldwide (OTIS), Boston Beer Company (SAM), Southwest Airlines (LUV), Teledyne (TDY), Tesla (TSLA), Texas Instruments (TXN), Vertiv (VRT), Whirlpool (WHR).
Click here to log on to your account or learn more about E*TRADE's trading platforms, or follow the Company on Twitter, @ETRADE, for useful trading and investing insights.
1 All figures reflect Tractor Supply (TSCO) daily prices, 1994-2026. Supporting document available upon request.