Market stumbles on AI volatility
E*TRADE from Morgan Stanley
Another bumpy month of trading left US stocks with an October loss, but still within the confines of what is now a nearly three-month trading range.
For most of the month, the market held up relatively well to an array of challenges—surging oil prices, rising inflation, Fed-policy uncertainty, and still-elevated Treasury yields—but weakness in the AI trade, especially at the very end of the month, tipped October’s scales in the bears’ direction.
The S&P 500 (SPX) jumped to a new record high in early October (as oil prices retreated) before zigzagging lower, with late-month volatility fueled by post-earnings declines from some of the market’s highest-profile AI stocks, along with $100-plus oil prices:
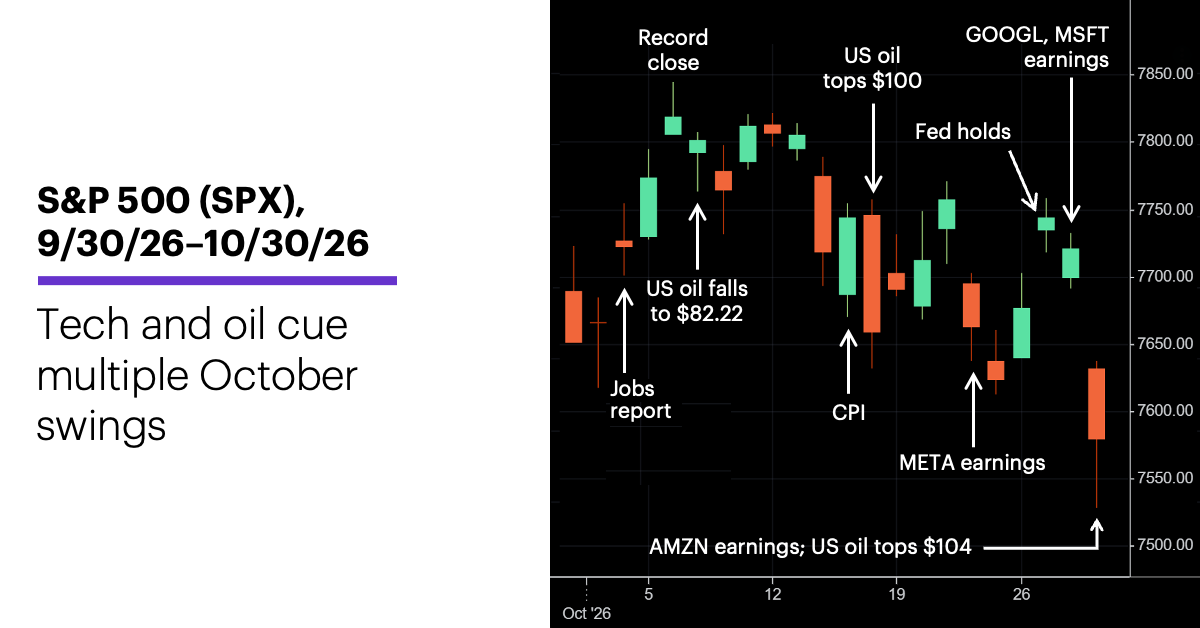
Source: Power E*TRADE. (For illustrative purposes. Not a recommendation. It is not possible to invest directly in an index.)
AI uncertainty drove tech volatility in October. Some disappointing earnings results and concerns that future profits may not justify the amount of money some AI-centric companies are spending—especially hyperscalers like Meta (META), Alphabet (GOOGL), Amazon (AMZN), and Microsoft (MSFT)—reverberated throughout the communication services and tech sectors, which were the only two that declined last month.
Rising oil prices kept inflation concerns on the front burner. US crude oil prices posted their third-biggest monthly dollar increase ($13.68) of the past five years, repeatedly interrupting bullish stock-market momentum. US spot crude ended the month at its second-highest price of the year, up 81% in 2026.
Energy was the S&P 500’s strongest sector, communication services was its weakest. Soaring oil and gas prices again benefited energy stocks, while the post-earnings sell-offs in Meta (META) and Alphabet (GOOGL) were a major factor in the communications services sector’s weakness.
Treasury yields eased for the month after hit fresh multi-year highs. The benchmark 10-year Treasury yield fell 36 basis points (0.36%) to 4.91%, but remained relatively close to its highest levels since 2007.
The US outperformed international markets. The MSCI Developed Markets Index and the MSCI Emerging Markets Index both declined in October—the latter weighed down by weakness in Asia and a sharp sell-off in Latin American stocks after the Brazilian presidential election.
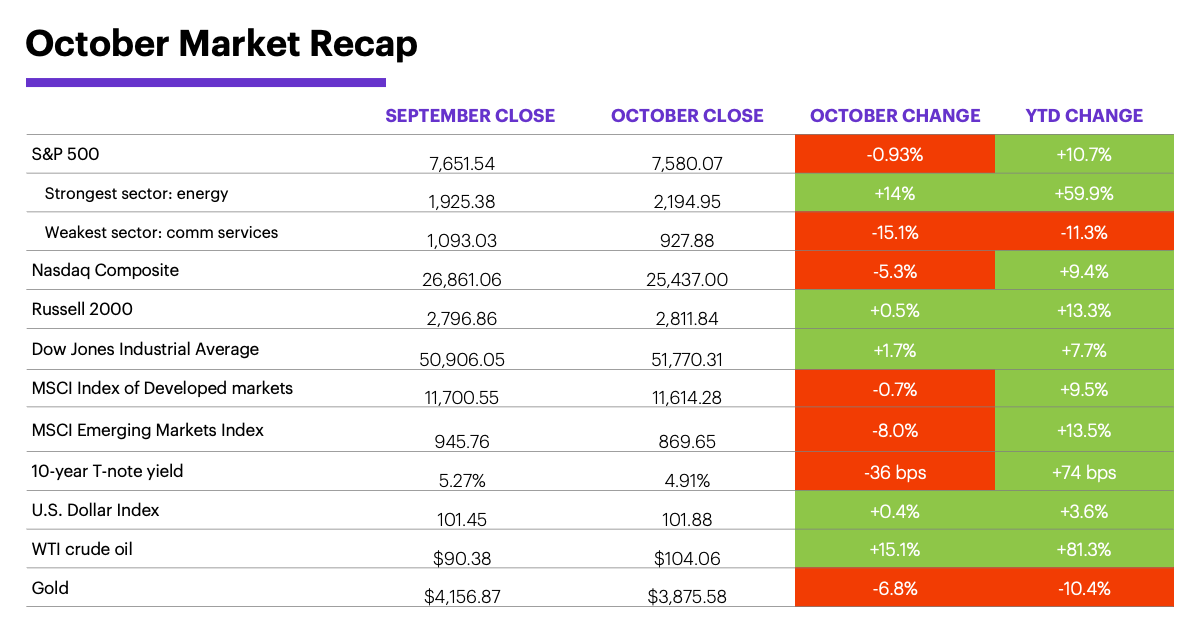
Data source: Power E*TRADE and FactSet. (For illustrative purposes. Not a recommendation. It is not possible to invest directly in an index.) Note: crude oil, gold, and U.S. Dollar Index data reflect spot-market prices. BPS (basis point) = 0.01%. MSCI Index of Developed Markets and MSCI Emerging Markets Index represent “total-return” performance (index change including dividend reinvestment). Past performance is not indicative of future results.
AI-linked capex isn’t slowing, it's broadening, according to Morgan Stanley Wealth Management strategists. Recent concerns about AI financing aren’t the end of the AI buildout, but they do mark a transition from a “compute”-led investment cycle to a power-, infrastructure-, and financing-led investment cycle. The narrative has shifted from "Is AI demand real?" to "Who can finance and power AI most effectively?"1
That signals different AI leadership. As the industry’s chief bottlenecks change, the strategists believe the next leaders will likely expand beyond semiconductors and hyperscalers into power, utilities, grids, cooling, electrical equipment, and gas generation. Meanwhile, financing is becoming a “competitive advantage:” With AI-related debt issuance reaching roughly $471 billion this year, the market’s focus is shifting to access to capital, balance-sheet strength, and financing costs.
The AI power story points to Asia. Data center capacity is still poised to more than double this decade, and with approximately 64% of global incremental power demand expected to come from Asia, the region is positioned to be a major beneficiary of AI infrastructure buildout.2
Waiting for the “all clear”? Morgan Stanley & Co. strategists’ base case is for the S&P 500 to reach 8,000 by year end, but they highlight three possible “clearing events” that may need to resolve first: 1) concerns about the “AI trade” and objections to data center construction, 2) midterm elections (typically an initial market headwind that usually leads to “very strong six- to 12-month returns after the event”), and 3) tighter financial conditions (which will likely “linger into November and/or until market developments lead the Fed to pivot”).3
The Fed didn’t raise rates in October, but hikes are likely on the way. The markets are pricing in three more rate hikes, but Morgan Stanley & Co. economics expect two, in December and March, as tightening financial conditions and Chair Warsh's emphasis on productivity-led growth “suggest less need for aggressive tightening.”4
But Iran and oil prices remain a wild card. The possibility that the Iran war could stretch well into 2027—keeping energy prices high—complicates the inflation picture, and Fed policy along with it. Higher energy prices may eventually slow growth next year and “do some of the Fed's work,” according to Morgan Stanley Wealth Management strategists, “but with no end to the Iran conflict in sight, inflation could prove more persistent than expected. If growth holds up, the Fed may need to hike more than investors expect.5
Gold can still function as a “safe haven” for investor portfolios, but perhaps not in the way most people think.
Insight of the month: gold’s safe-haven role. After a 66% rally in 2025, gold has fallen as much as 29.5% from its January record high. Morgan Stanley & Co. analysts believe it still has a role as a portfolio “safe haven,” but not in the way most people think. Prior to 2020, they explain, gold was a “good enough” stock hedge, but since then it has amplified stock instead of cushioning them. Where gold does work, they say, is as a hedge against bond volatility, dampening losses during worst weekly US Treasury sell-offs.6
The midterm elections may have limited market impact. While Morgan Stanley & Co. strategists believe conditions favor Democrats gaining control of the House of Representatives, they don’t expect the resulting “divided government” to change the fact that policy will continue to be driven by the White House rather than the legislative branch. They also note that “midterms typically don't produce outsized market over- or under-performance over the next three to six months.”7
November stock market history. November has been one of the most consistently positive—and strongest—months for the S&P 500. Over the past 30 years, November was positive more often than any other month (80% of the time) and had the largest average return (2.5%).8
Important November dates: midterm elections (11/3), Employment Report (11/6), CPI (11/10), PPI (11/13), Retail Sales (11/17), FOMC minutes (11/18), Housing Starts (11/18), monthly stock options expiration (11/20), PCE Price Index (11/25), Q3 GDP, second estimate (11/25).
Click here to log on to your account or learn more about E*TRADE's trading platforms, or follow the Company on X (Twitter), @ETRADE, for useful trading and investing insights.
1 MorganStanley.com. Market Update from Lisa Shalett, Chief Investment Officer of Morgan Stanley Wealth Management: GIC Quick-Take. 10/27/26.
2 MorganStanley.com. Agents, Aircons, Allshoring: All Not Priced In. 10/26/26.
3 MorganStanley.com. Weekly Warm-up: Clearing Events Still Ahead. 10/26/26.
4 MorganStanley.com. October FOMC Reaction: Tightening Without Urgency. 10/29/26.
5 MorganStanley.com. The Fed's Inflation Dilemma: Macro Update from Ellen Zentner, Chief Economic Strategist & Global Head of Thematic and Macro Investing for Morgan Stanley Wealth Management.
6 MorganStanley.com. Gold: Same Haven, Different Storm. 10/26/26.
7 MorganStanley.com. Midterm FAQs: Two Weeks Out. 10/20/26.
8 Figures reflect S&P 500 (SPX) monthly closing prices, 1957–2025. Supporting document available upon request.
Because of their narrow focus, sector investments tend to be more volatile than investments that diversify across many sectors and companies. Technology stocks may be especially volatile. Risks applicable to companies in the energy and natural resources sectors include commodity pricing risk, supply and demand risk, depletion risk and exploration risk. Health care sector stocks are subject to government regulation, as well as government approval of products and services, which can significantly impact price and availability, and which can also be significantly affected by rapid obsolescence and patent expirations.
Yields are subject to change with economic conditions. Yield is only one factor that should be considered when making an investment decision.