AI retreat stymies bulls
- Hyperscaler weakness and rising oil challenge market
- Small- and mid-cap stocks rally, gold tumbles
- This week: jobs report, 1,500-plus earnings, midterms
Last week GDP came in stronger than expected, low jobless claims highlighted continued labor-market strength, inflation data was in line with estimates, and the Fed didn’t hike interest rates.
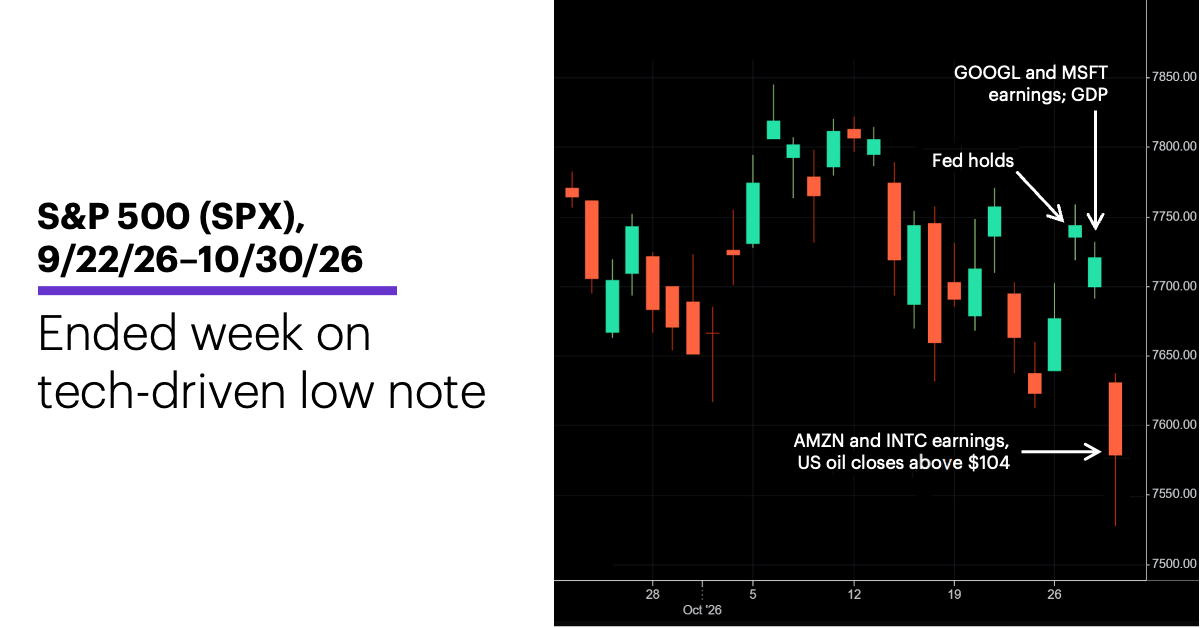
But none of that appeared to matter as the S&P 500 (SPX) pivoted lower to post its third-straight down week (and second-straight down month). led by some of the market’s bellwether AI companies.
Last Wednesday the SPX was solidly higher for the week (and positive for the month) before negative responses to key earnings—along with a continued surge in oil prices—dropped the index to its lowest level since mid-September:
Source: Power E*TRADE. (For illustrative purposes. Not a recommendation. Note: It is not possible to invest in an index.)
The headline: AI spending concerns continue to dominate market sentiment.
The fine print: A week after Meta (META) reported its Q3 free cash flow (FCF) was in the red by more than $2 billion, Alphabet (GOOGL) reported FCF of roughly $9.1 billion—more than three times expectations. GOOGL’s subsequent drop appeared to weigh on Microsoft (MSFT), which initially rallied after posting relatively strong numbers. Amazon’s (AMZN) decline the next day completed a trifecta of AI hyperscaler earnings sell-offs, which—with an assist from Intel’s (INTC) post-earnings drop—helped lock in negative weekly and monthly returns for the SPX. (However, Morgan Stanley & Co. analysts were quick to highlight a more-bullish longer-term picture for AMZN.1)
The number: 9 (out of 11), the number of positive SPX sectors last week.
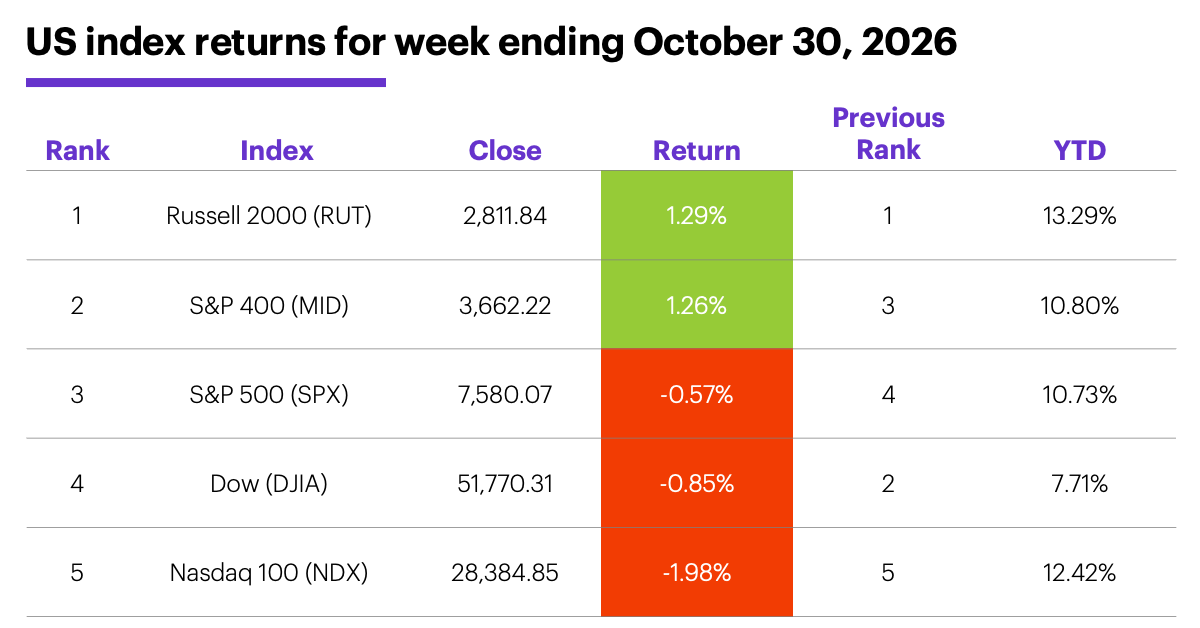
The scorecard: The Nasdaq 100 (NDX) tech index took the biggest step back, while the Russell 2000 (RUT) small-cap and S&P 400 mid-cap indexes both posted solid gains:
Source (data): Power E*TRADE. (For illustrative purposes. Not a recommendation.)
S&P 500 sector returns: The strongest S&P 500 sectors last week were health care (+3.1%), materials (+2%), and utilities (+2%). The weakest sectors were communication services (-8.5%), tech (-1.8%), and consumer discretionary (+1%).
S&P 500 stock movers: Last week’s biggest gains were Pentair (PNR) +19% to $66.26, Carvana (CVNA) +19% to $68.29, and Vertiv (VRT) +19% to $232.5. The biggest losses were Reddit (RDDT) -36% to $91.73, ServiceNow (NOW) -34% to $105.12, and Intel (INTC) -26% to $65.76. Other moves: Surgery Partners (SGRY) +48% to $23.25 and XP (XP) -48% to $15.71, both on Monday.
Yields and the dollar: The benchmark 10-year US Treasury yield fell nine basis points (0.09%) to 4.91% last week, in large part because of “flight-to-safety” Treasury buying on Friday. The US Dollar Index (DXY) climbed 0.07 to 101.88.
Commodity futures: WTI crude oil futures (CLZ6) closed Friday at $104.12, up $0.85 for the week. Gold fell to its lowest level in more than a year—a 3.3% sell-off on Friday left December gold (GCZ6) down $109 at $3,898.90 for the week. Biggest gains: January Brent crude oil (BF7) +2.4%, December RBOB gasoline (RBZ6) +2.2%. Biggest declines: December silver (SIZ6) -5.9%, January platinum (PLF7) -3.8%.
Crypto: Bitcoin -4.8% to $77,198.21 last week, Ether -6% to $2,241.05, Solana -6.38% to 96.22.
Coming this week
Labor market data—culminating in Friday’s monthly jobs report—dominates the economic calendar:
●Monday: S&P Global Manufacturing PMI, ISM Manufacturing Index, Construction Spending
●Tuesday: Job Openings and Labor Turnover Survey, Factory Orders, midterm elections
●Wednesday: ADP Private Employment, Balance of Trade, S&P Global Services PMI, ISM Services Index
●Thursday: Job Cuts, Productivity and Labor Costs (prelim)
●Friday: Employment Report, Consumer Sentiment (prelim)
Here’s a sample of the more than 1,500 companies scheduled to report earnings this week—everything from big tech to consumer names:
●Monday: Apple (AAPL), Aehr Test Systems (AEHR), Clorox (CLX), Estee Lauder (EL), Lattice Semiconductor (LSCC), Match Group (MTCH), ON Semiconductor (ON), Palantir (PLTR), Qorvo (QRVO), Silicon Laboratories (SLAB)
●Tuesday: Archer Daniels Midland (ADM), Astera Labs (ALAB), Advanced Micro Devices (AMD), Booking Holdings (BKNG), BioNTech (BNTX), Duolingo (DUOL), Keurig Dr. Pepper (KDP), Navitas Semiconductor (NVTS), Pfizer (PFE), Shopify (SHOP), Yum Brands (YUM)
●Wednesday: Applovin’ (APP), Arm Holdings (ARM), Circle Internet (CRCL), E.L.F. Beauty (ELF), Hut 8 (HUT), Kraft Heinz (KHC), McDonald's (MCD), MercadoLibre (MELI), Murphy Oil (MUR), Novo Nordisk (NVO), Revolution Medicines (RVMD), Uber (UBER), Wayfair (W)
●Thursday: Airbnb (ABNB), Kimberly Clark (KMB), Lyft (LYFT), Mattel (MAT), MP Materials (MP), Cloudflare (NET), Ralph Lauren (RL), Rockwell Automation (ROK), Tapestry (TPR), Verisk Analytics (VRSK)
●Friday: Humana (HUM), Moderna (MRNA), USA Rare Earth (USAR), Vistra (VST)
The stock market in November
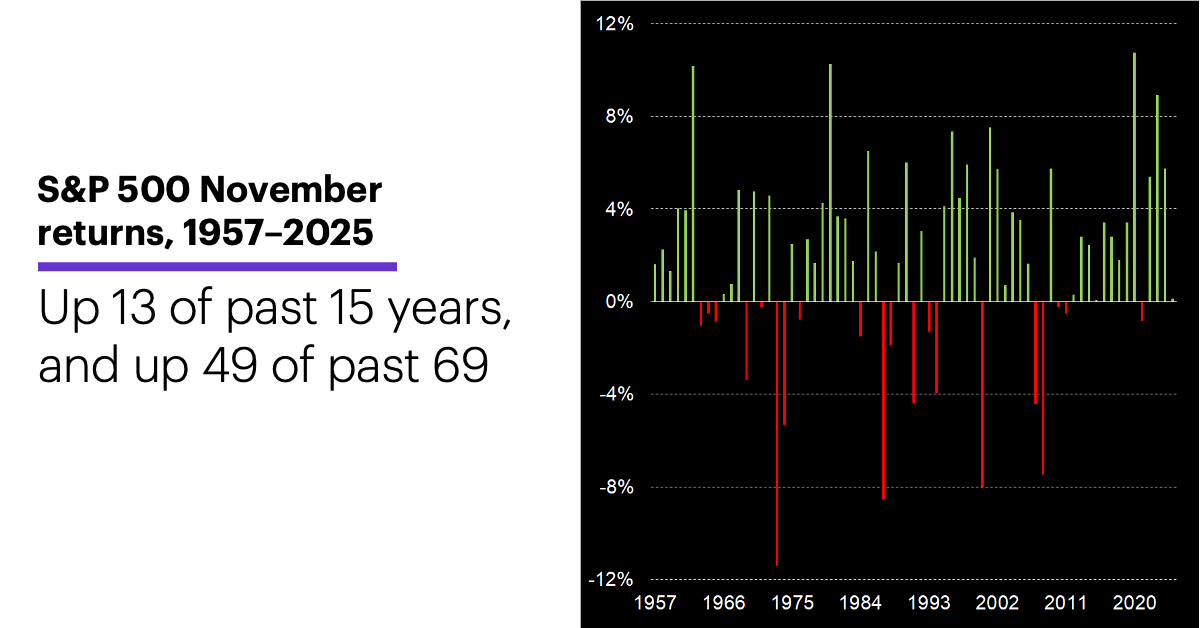
Historically, November has been one of the most consistently bullish months US stocks, especially in recent decades. Since 1996, the SPX had a positive return in November more often than in any other month (80% of the time), and also had the largest average return (2.5%). Thirteen of the past 15 Novembers have been positive (although last year’s just squeaked by).
Since 1957, November has been a positive month in 49 out of 69 years:
Source (data): Power E*TRADE Pro. (For illustrative purposes. Not a recommendation. Note: It is not possible to invest in an index.)
There has been a tendency for November to be relatively weaker following negative Octobers (and/or negative Septembers), although returns were still net positive over time. Since 1957, when both September and October had positive returns, November’s median return was 2.8%. When September and October were both negative—which had happened only 14 times before this year—November’s median return was 1.7%, and it was a positive month nine times.1
But as October’s negative return illustrates, seasonal factors always take a back seat to the dominant economic and business catalysts that are playing out in the market at a given time.
Click here to log on to your account or learn more about E*TRADE's trading platforms, or follow the Company on X (Twitter), @ETRADE, for useful trading and investing insights.
1 MorganStanley.com. Tricky Today, But Trillions of Treats on the Way. 10/30/26.
2 All figures reflect S&P 500 (SPX) weekly prices, 1990-2026. Supporting document available upon request.