Market Dashboard
New every Monday with last week’s recap and notes on the week ahead.
Last update: 3/30/2026
U.S. equities faced a correction amid re-escalating U.S.-Iran tensions, with the S&P 500 declining for a fifth straight week and the Nasdaq Composite falling more than 10% from its recent peak. Brent crude oil jumped as the Strait of Hormuz remained largely closed. Bond yields also rose, reflecting inflation concerns. Labor data remained stable.
Geopolitical risks trigger a stock pullback
- Major stock indexes entered correction territory, after Iran rejected a U.S. ceasefire proposal and subsequent strikes drove retaliation threats and doubts about a near-term resolution.
- The S&P 500 Index fell 2.1% to 6,369 in its fifth straight weekly decline, the longest weekly losing streak since May 2022. The large-cap U.S. equity index is down 8.7% from its all-time high and 7.0% year to date.
- The Nasdaq Composite Index fell 3.2% to its lowest level since August, entering correction territory at 12.6% below its recent peak.
- The small-cap Russell 2000 Index rose 0.5% for the week.
- The Cboe Volatility Index (VIX), known as the stock market’s fear gauge, moved above 30, signaling elevated investor stress.
- Bond volatility and more hawkish Federal Reserve expectations pressured stock valuations. The S&P 500’s forward price-to-earnings (P/E) ratio was down more than 17% from its peak, while the Nasdaq’s also retreated back to roughly “Liberation Day” levels as Information Technology underperformed.
- A potential bright spot—rising 2026 earnings-per-share estimates—looks concentrated in Information Technology, suggesting sector-driven revisions rather than broad strength.
Oil rises as conflict risks intensify
- Brent crude oil rose near $113 as the Strait of Hormuz remained largely closed due to the conflict.
- The U.S. Dollar Index (DXY) strengthened modestly alongside oil.
- Gold rebounded Friday to $4,511 per ounce after trading largely in line with risk assets earlier in the week.
Treasury yields rise and borrowing costs tighten
- U.S. Treasuries sold off on renewed concerns about the conflict’s duration and its potential inflationary pressures, with a weak Treasury auction adding pressure.
- The two-year Treasury yield rose 1 basis point to 3.91% last week, while the 10-year Treasury yield rose 5 basis points to 4.43%.
- Long-duration yields rose to the highest levels of the year, with the 30-year nearing 5.0%.
- Markets implied a 24% probability of a rate hike in 2026.
- Financial conditions tightened as higher rates lifted borrowing costs across the economy. Freddie Mac’s 30-year fixed mortgage rate rose to 6.38%, the highest level since September.
Price pressures rise as growth cools
- March preliminary S&P Global Purchasing Managers’ Indexes (PMIs) pointed to a “stagflationary” mix of slower growth with rising inflation pressures.
- Composite PMI fell to 51.4, below consensus expectations, with weaker services offsetting a modest upside surprise in manufacturing.
- Survey details: Business activity slowed to an 11-month low, while input costs jumped to a 10-month high on higher energy costs. Selling prices rose at the fastest pace in more than three years. Employment contracted for the first time in over a year as firms reduced headcount amid uncertainty.
Jobless claims data show limited layoff signs
- Labor market data remained broadly stable, with initial jobless claims holding at 210,000, in line with expectations. Continuing claims fell to 1,819,000, the lowest since May 2025.
- The four-week moving average for jobless claims edged down, consistent with limited evidence of broad-based layoffs.
CRC# 5335641 (03/2026)
How can E*TRADE from Morgan Stanley help?
Playing defense
Find opportunities to invest in companies that may have the ability to weather tough economic times.
Hedging Inflation
Discover ways to invest in securities that may help your portfolio resist the effects of inflation while also keeping risk and volatility in check.
Futures
Like options, futures let you lock in a price now for an investment you’ll buy in the future. They cost much less than the actual investment, so you can control a large contract with a relatively small amount of capital.
Certificates of Deposit (CD)
Fixed rates. Annual Percentage Yield up to 1,2
Lock in a competitive fixed rate for terms from to .3
Morgan Stanley Private Bank, Member FDIC.
Cross-Asset Performance Table
Returns and prices of the most popular indices and assets as of 03/27/26.
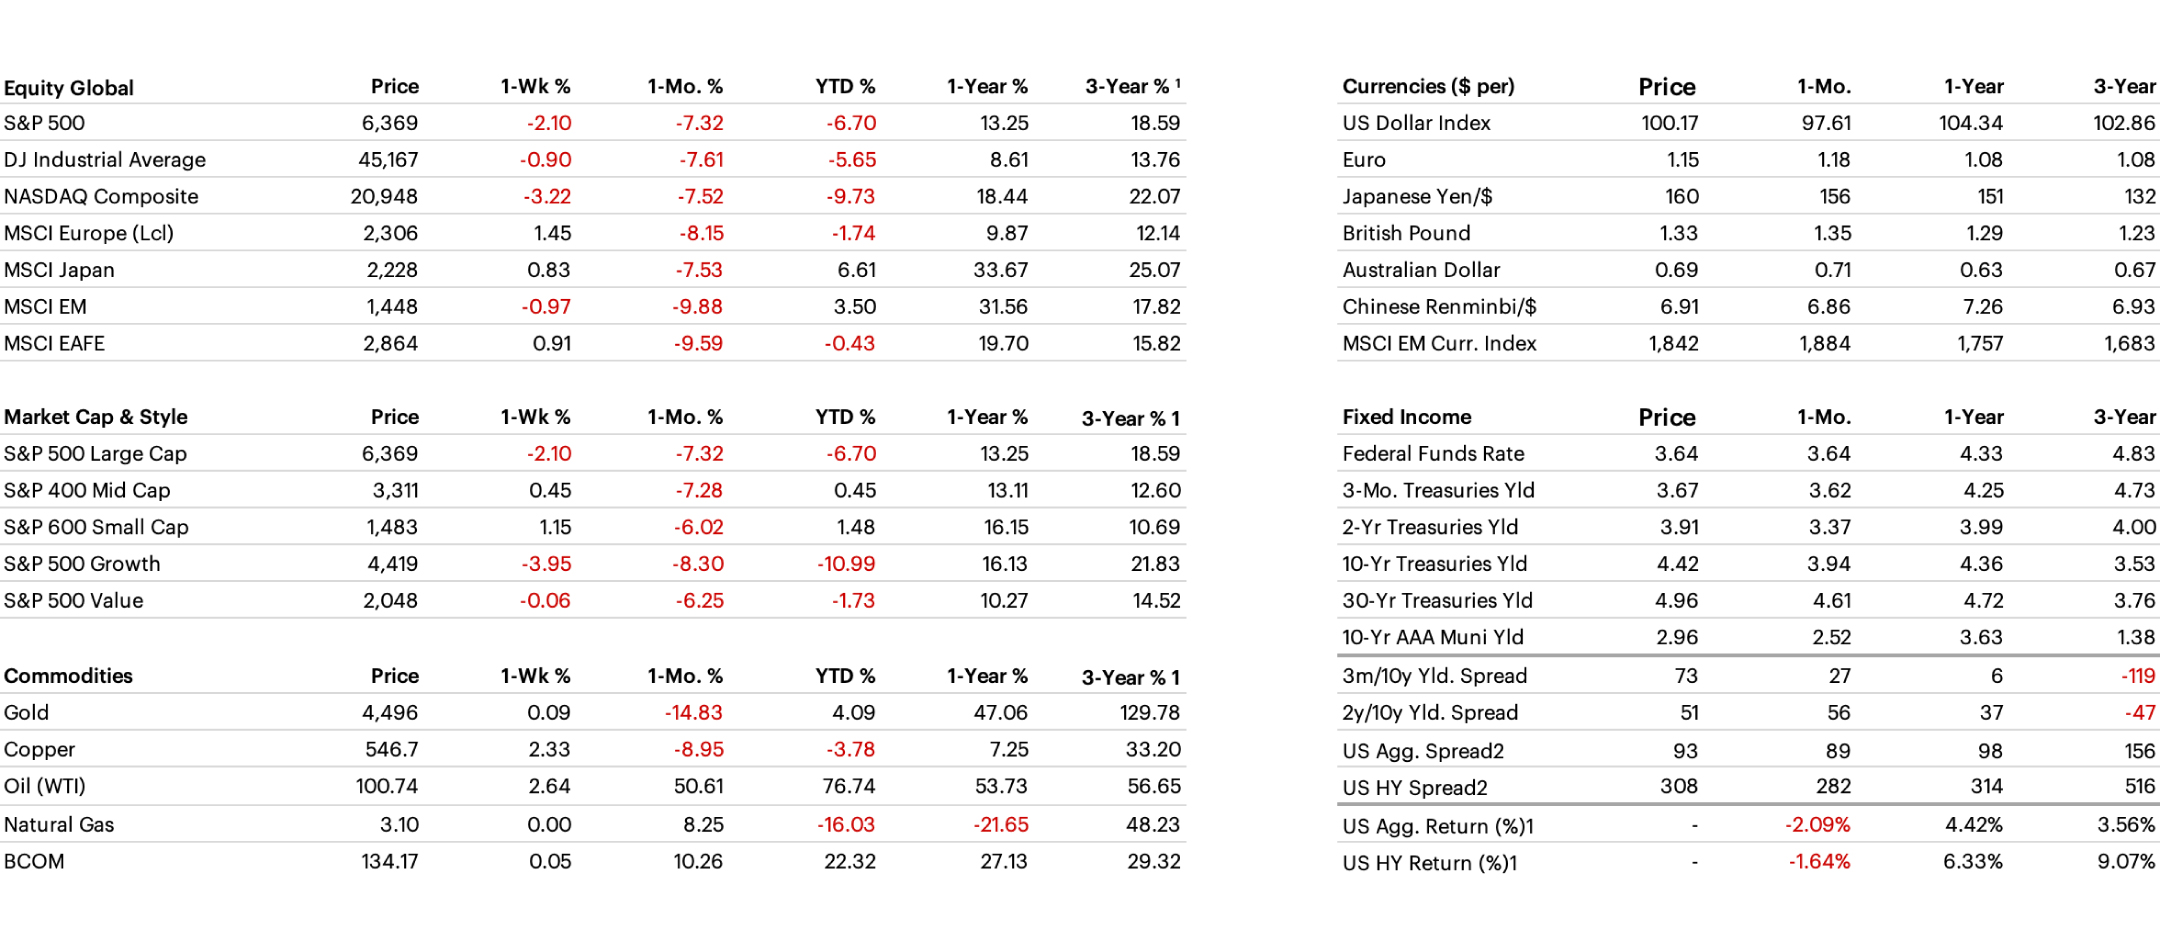
1) Annualized 3-year % return. 2) Option Adjusted Spread (OAS): OAS is a measurement of the spread of a fixed income security rate and the risk-free rate of return, which is adjusted to take into account an embedded option. Equity risk premium is the excess return that an individual stock or the overall stock market provides over a risk-free rate. The risk-free rate represents the interest an investor would expect from an absolutely risk-free investment over a specified period of time. Past performance is not indicative of future results.
S&P 500 Sector Performance
Energy and Materials were the strongest-performing S&P 500 sectors last week, while Information Technology and Communication Services lagged.
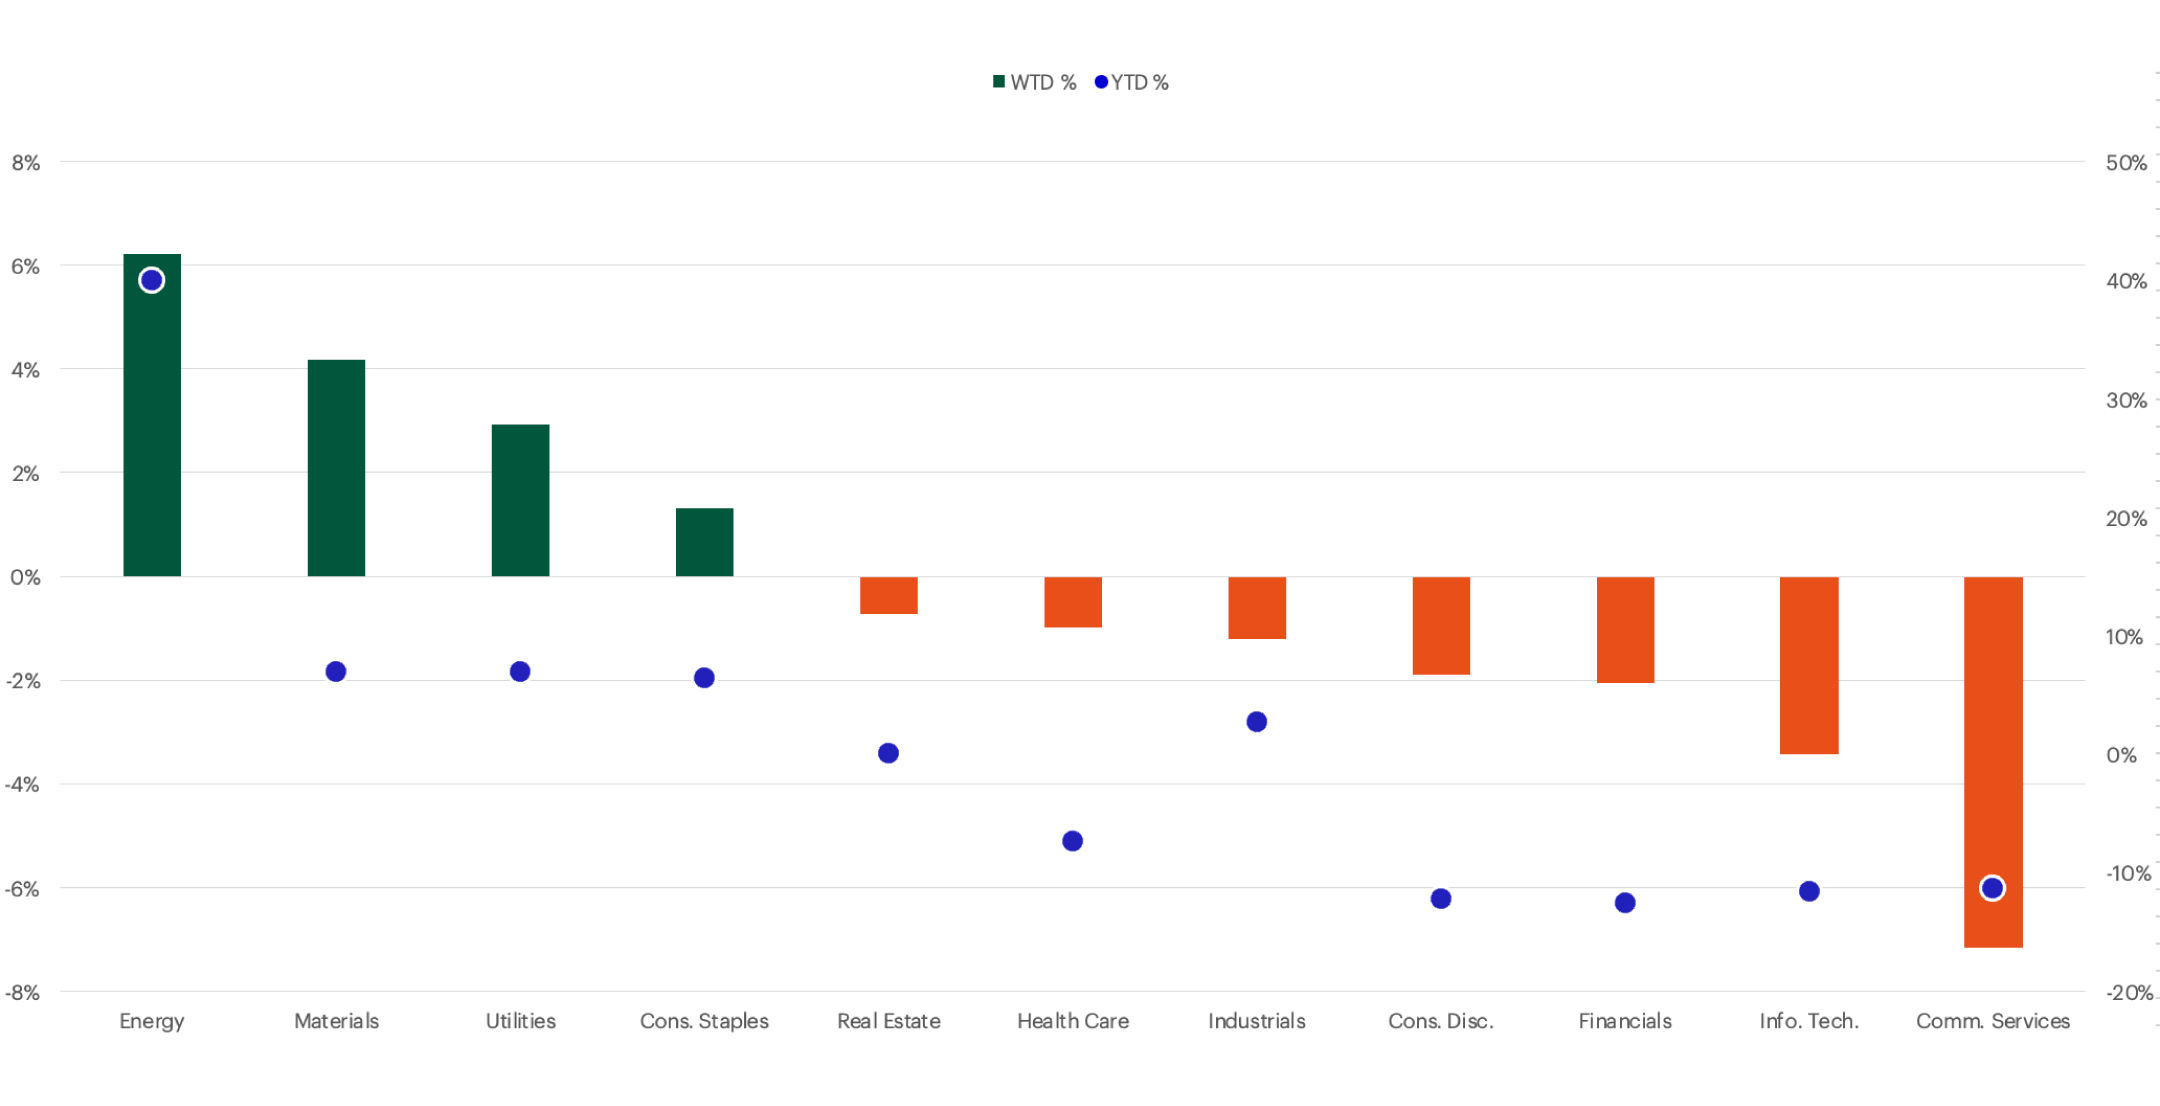
Past performance is not indicative of future results.
Russell US Equity Style Performance
Small-cap stocks outperformed large-cap equities.
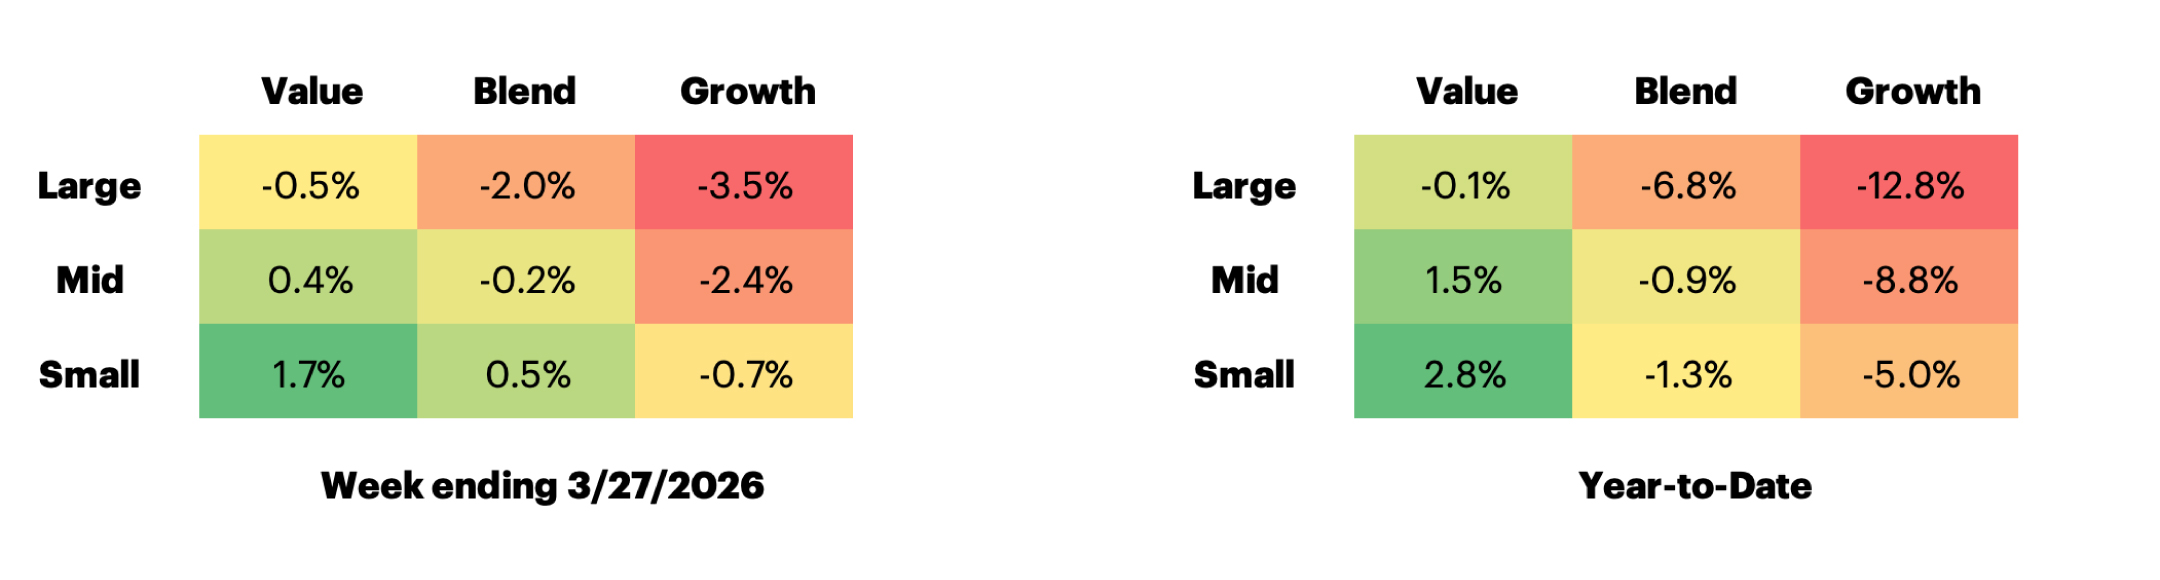
Past performance is not indicative of future results.
US Equity Valuation
S&P 500 Equity Risk Premium
Bonds continue to appear attractive relative to equities.
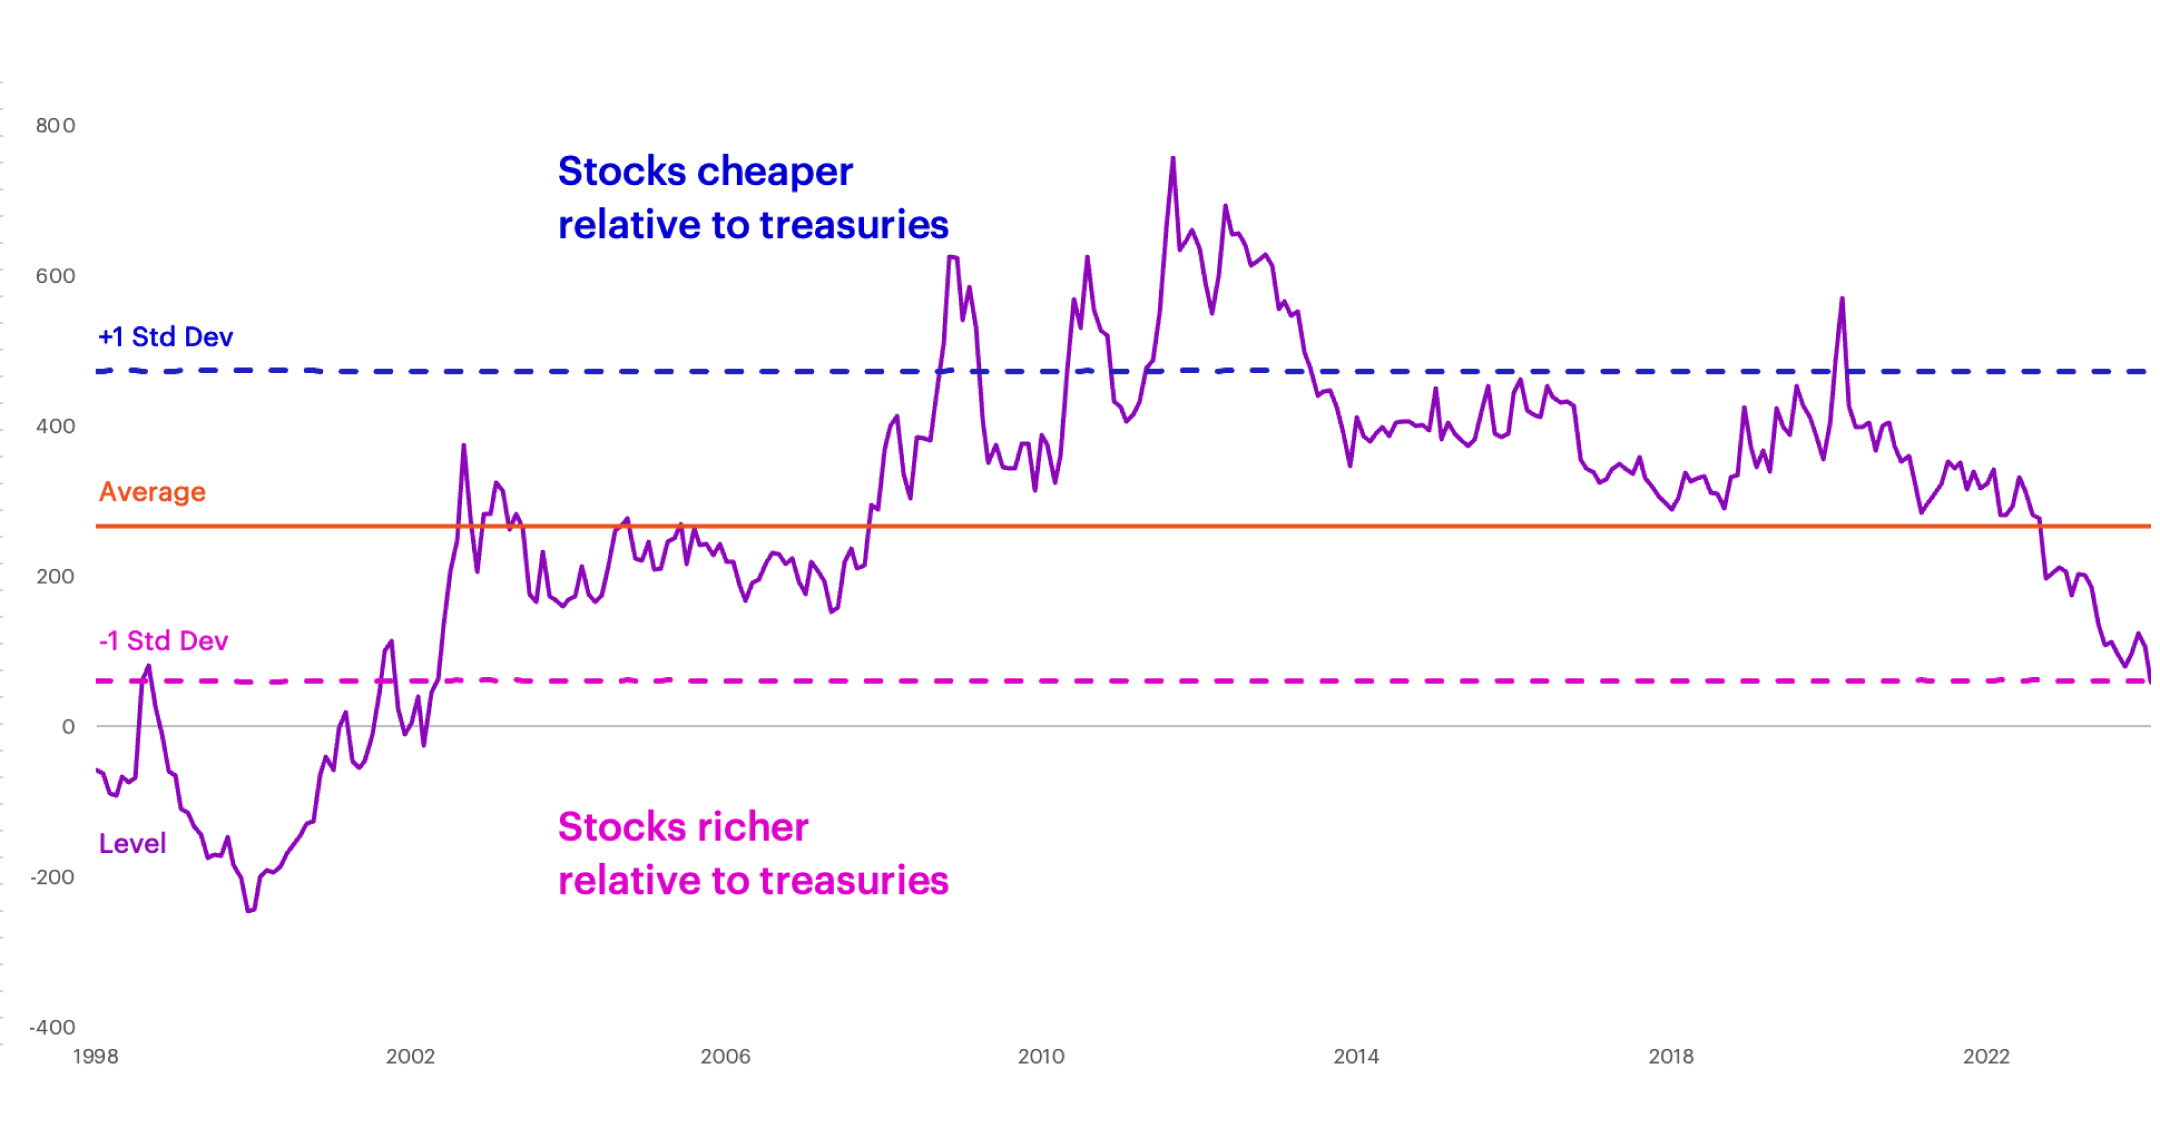
Past performance is not indicative of future results.
P/E Relative to Rest of World
The S&P 500 remains expensive relative to the rest of the world.
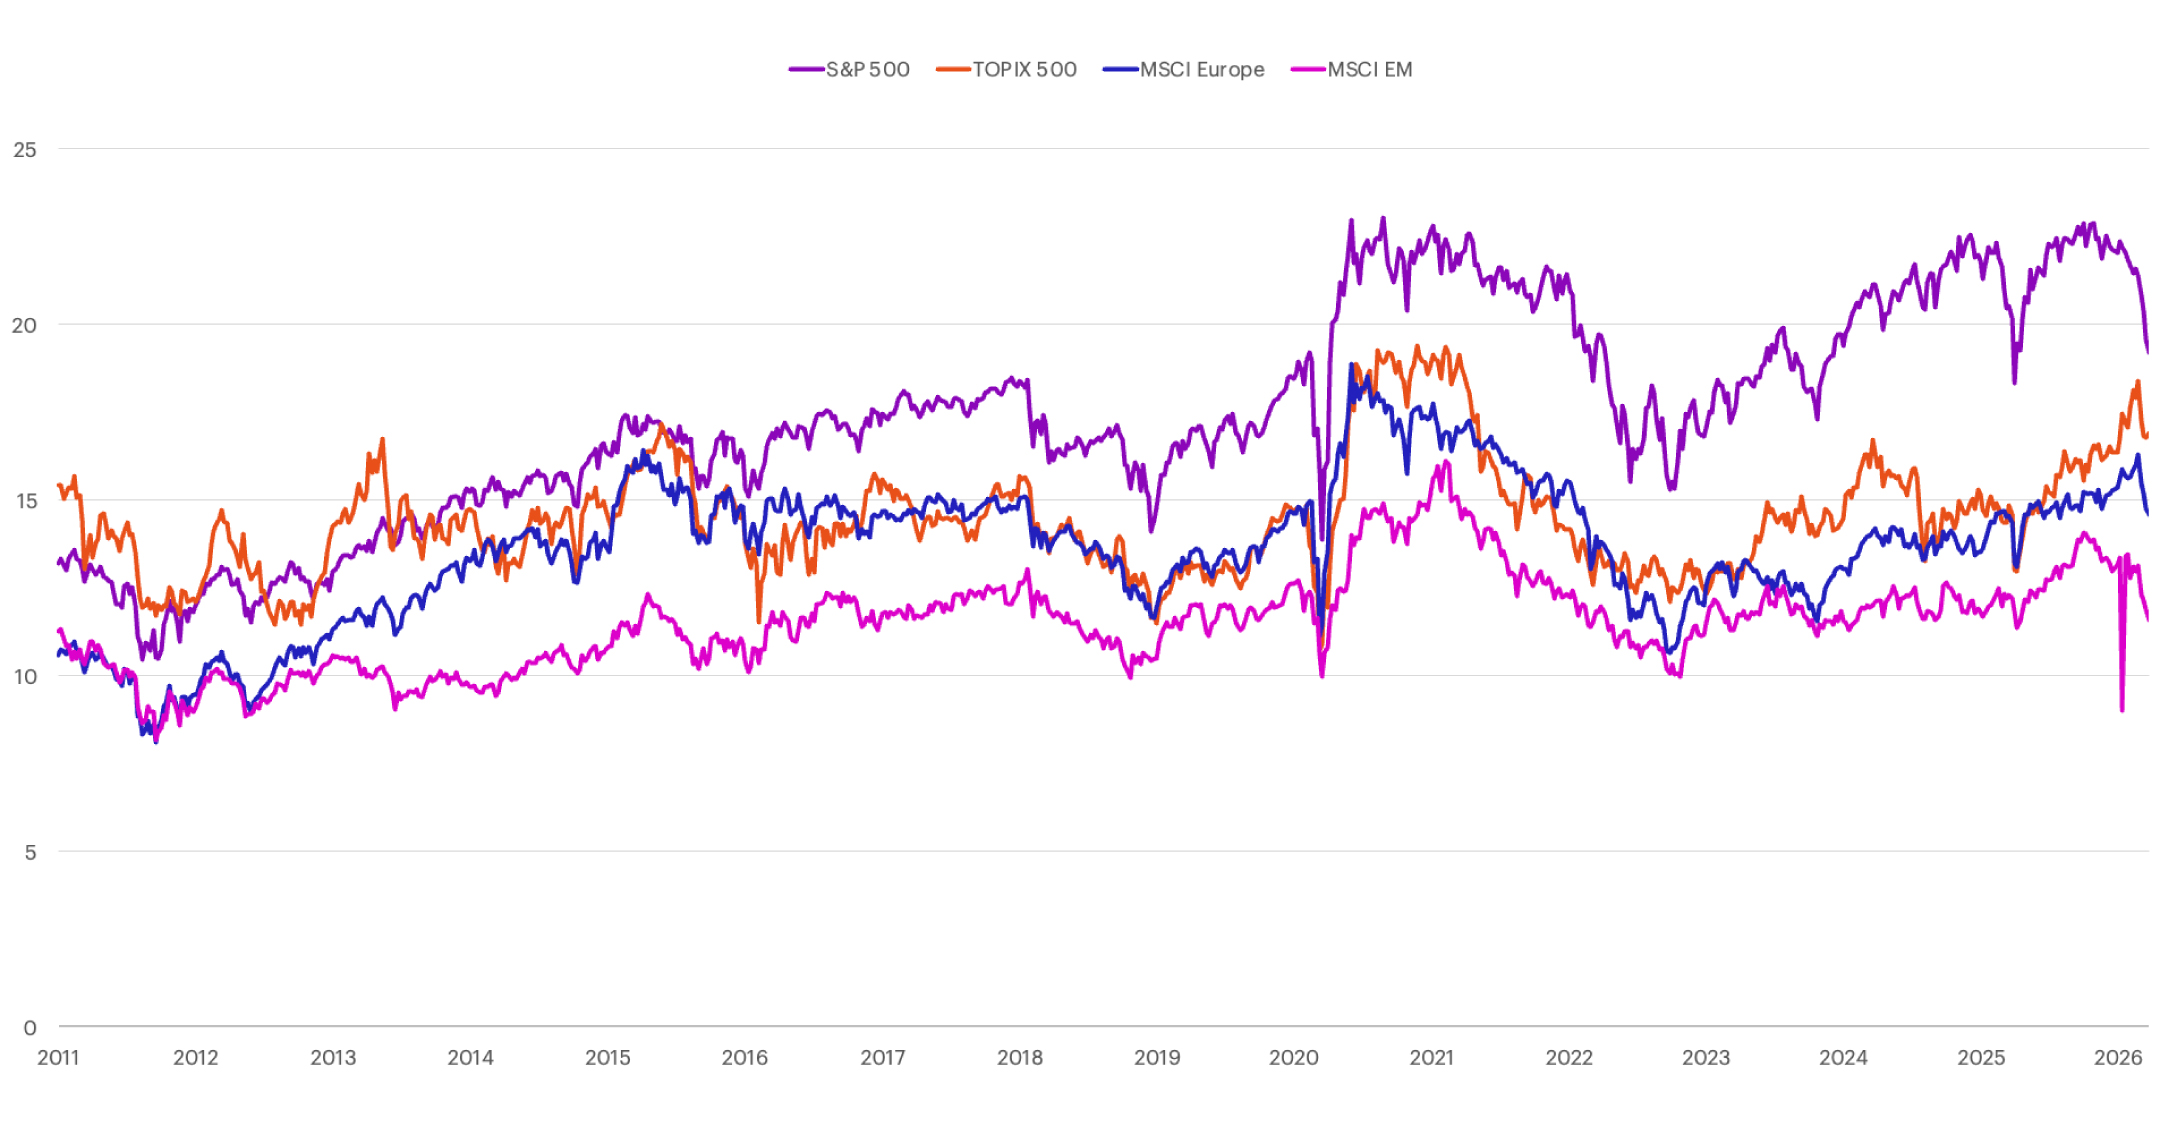
Past performance is not indicative of future results.
US Fixed Income Valuation
The two-year Treasury yield increased 1 bp to 3.91% last week, while the 10-year Treasury yield increased 5 bps to 4.43%.
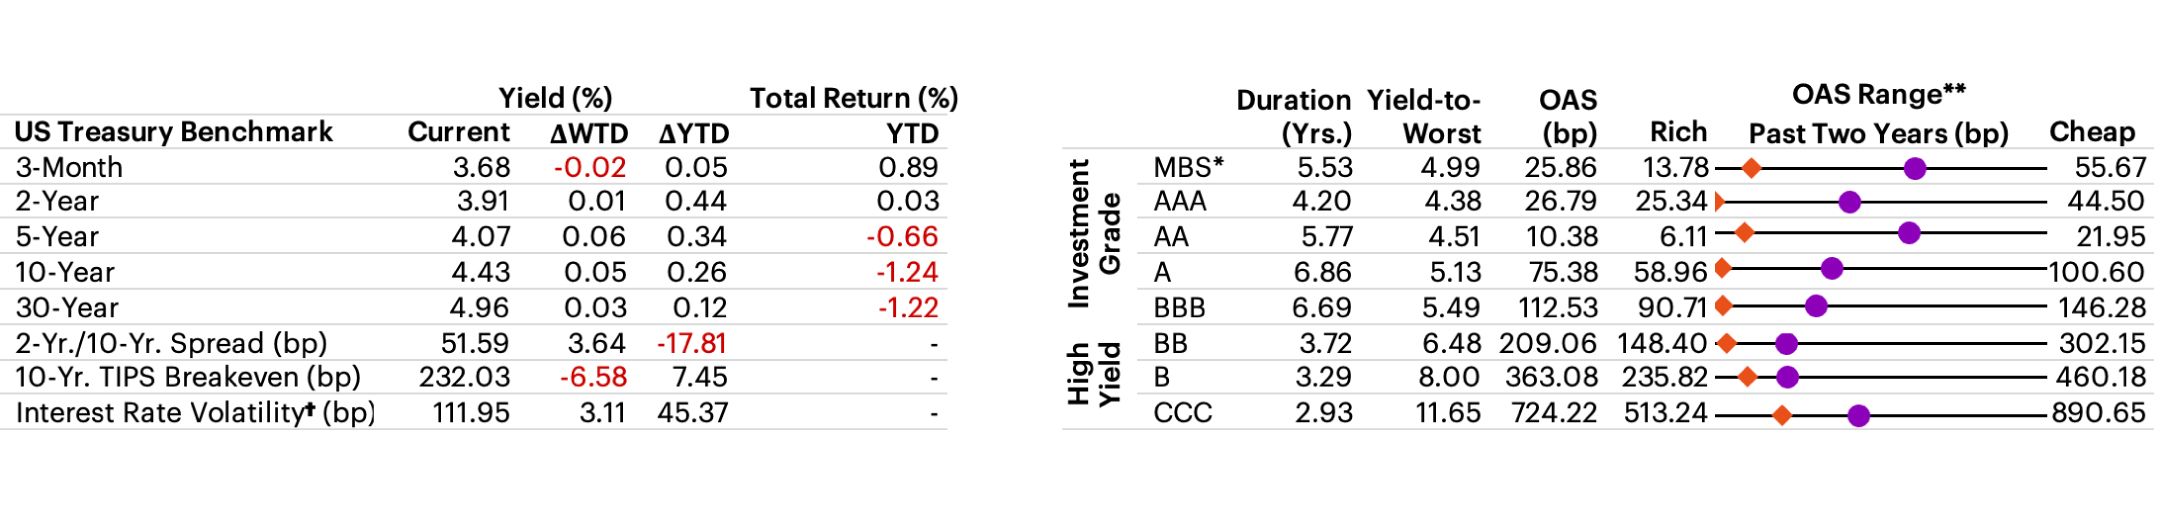
†Interest Rate Volatility as measured by ICE BofAML Option Volatility Estimate Index (MOVE); *Mortgage-backed securities (MBS) are debt obligations that represent claims to the cash flows from pools of mortgage loans, most commonly on residential property. Mortgage loans are purchased from banks, mortgage companies, and other originators and then assembled into pools by a governmental, quasi-governmental, or private entity; **Options Adjusted Spread (OAS): A measurement of the spread of a fixed income security rate and the risk-free rate of return, which is adjusted to take into account an embedded option. Past performance is not indicative of future results.
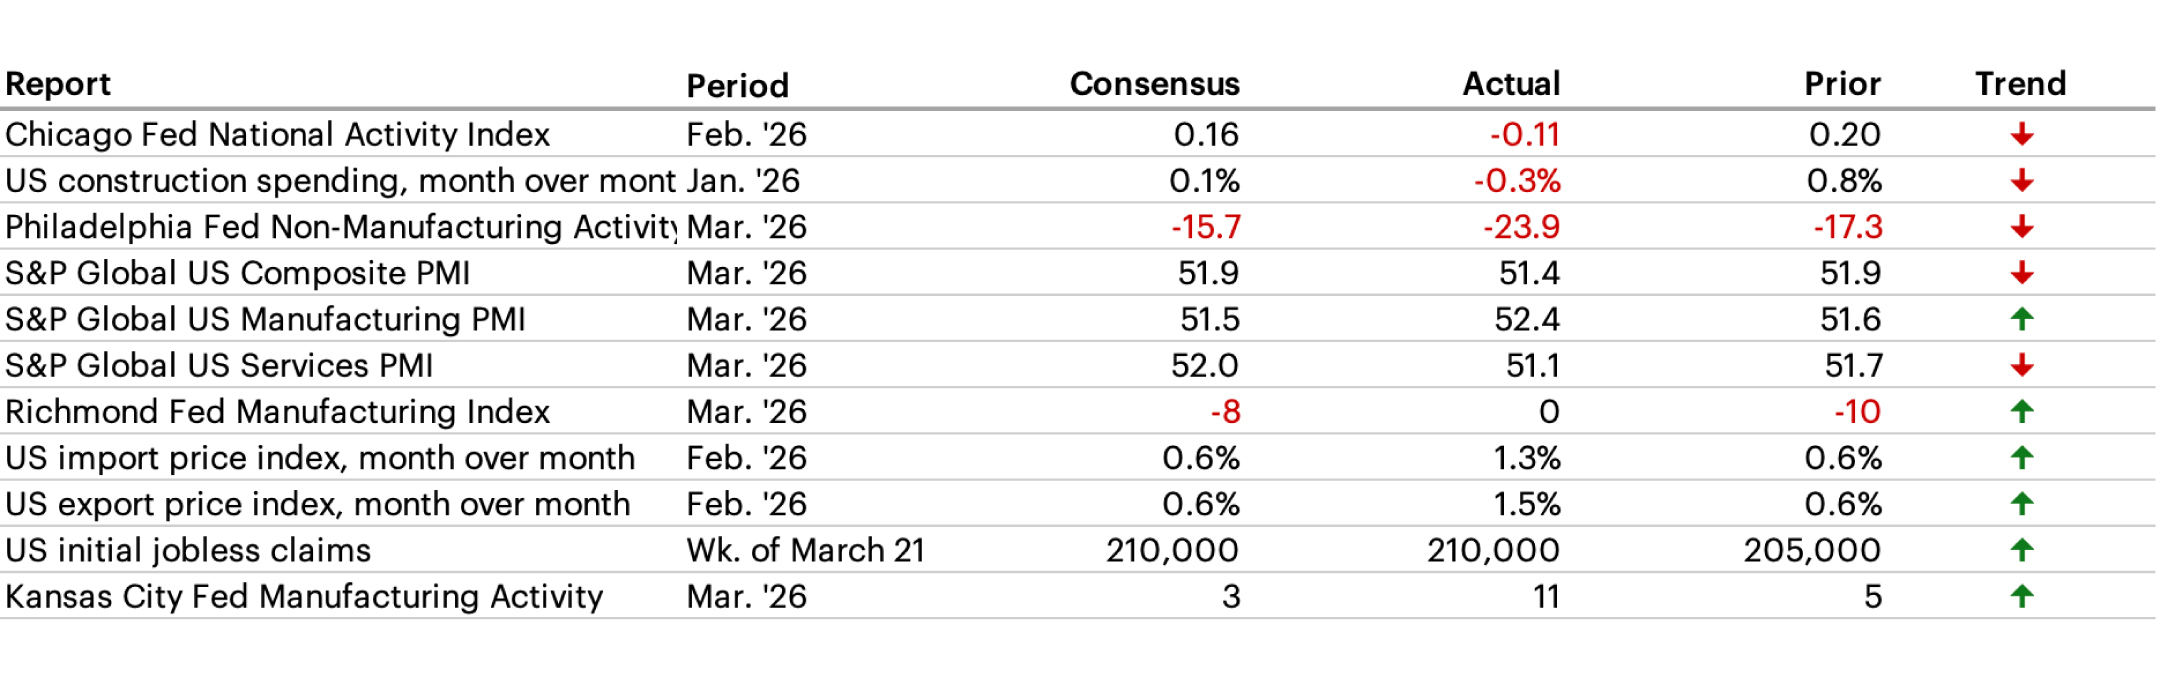
Latest Economic Data
March preliminary S&P Global Purchasing Managers’ Indexes (PMIs) pointed to a “stagflationary” mix of slower growth with rising inflation pressures. Composite PMI fell to 51.4, below consensus expectations, with weaker services offsetting a modest upside surprise in manufacturing.
The Week Ahead
The week ahead brings readings from the Conference Board Consumer Confidence surveys for March, Institute for Supply Management (ISM) manufacturing data for March, private-sector job cut announcements for March, the Job Openings and Labor Turnover Survey (JOLTS) for February, and U.S. retail sales for February.
- Dallas Fed Manufacturing Activity Survey at 10:30 AM ET
- March 31 Conf. Board Consumer Confidence Index
- March 31 US JOLTS Survey
- March 31 Dallas Fed Services Activity Survey
- Nike, Inc. Reports Earnings
- April 1 MBA Mortgage Applications
- April 1 ADP Employment Change
- April 1 US retail sales
- April 1 ISM Manufacturing Index
- April 1 US business inventories
- April 2 Challenger Job Cuts Announcements
- April 2 US trade balance
Index benchmarks
Cross-Asset Performance
S&P 500: A market capitalization-weighted index of 500 widely held stocks often used as a proxy for the stock market. It measures the movement of the largest issues. Standard and Poor's chooses the member companies for the 500 based on market size, liquidity and industry group representation. Included are the stocks of industrial, financial, utility, and transportation companies. Since mid-1989, this composition has been more flexible and the number of issues in each sector has varied. The returns presented for the S&P 500 are total returns, including the reinvestment of dividends each month.
Dow Jones Industrial Average: Computed by summing the prices of the stocks of 30 companies and then dividing that total by an adjusted value—one which has been adjusted over the years to account for the effects of stock splits on the prices of the 30 companies. Dividends are reinvested to reflect the actual performance of the underlying securities.
NASDAQ Composite: Measures the performance of all issues listed in the NASDAQ Stock Market, except for rights, warrants, units, and convertible debentures. Morningstar reports the NASDAQ Composite as a price return.
MSCI Europe IMI: This index captures large, mid and small cap representation across 16 Developed Markets countries in Europe. With 1,372 constituents, the index covers approximately 99% of the free float-adjusted market capitalization across the Developed Markets countries of Europe.
MSCI Japan IMI: This index is designed to measure the performance of the large, mid and small cap segments of the Japan market. With 1,134 constituents, the index covers approximately 99% of the free float-adjusted market capitalization in Japan.
MSCI EM (Emerging Markets) Index: A free float-adjusted market-capitalization index that is designed to measure equity market performance of emerging markets. The MSCI Emerging Markets Index consists of the following 23 emerging market country indexes: Brazil, Chile, China, Colombia, Czech Republic, Egypt, Greece, Hungary, India, Indonesia, Korea, Malaysia, Mexico, Peru, Philippines, Poland, Qatar, Russia, South Africa, Taiwan, Thailand, Turkey and United Arab Emirates. For more information, visit the MSCI web site.
MSCI EAFE (Europe, Australasia, Far East) Index: A free float-adjusted market-capitalization index that is designed to measure the equity market performance of developed markets, excluding the U.S. and Canada. The MSCI EAFE Index consists of the following 21 developed market country indexes: Australia, Austria, Belgium, Denmark, Finland, France, Germany, Hong Kong, Ireland, Israel, Italy, Japan, the Netherlands, New Zealand, Norway, Portugal, Singapore, Spain, Sweden, Switzerland, and the United Kingdom. For more information, visit the MSCI website.
S&P 400 Index: This index provides investors with a benchmark for mid-sized companies. The index measures the performance of mid-sized companies, reflecting the distinctive risk and return characteristics of this market segment.
S&P 600 Index: This index measures the small-cap segment of the U.S. equity market. The index is designed to track companies that meet specific inclusion criteria to ensure that they are liquid and financially viable.
S&P 500 Growth: This index is a style-concentrated index designed to track the performance of stocks that exhibit the strongest growth characteristics by using a style-attractiveness-weighting scheme.
S&P 500 Value: This index is a style-concentrated index designed to track the performance of stocks that exhibit the strongest value characteristics by using a style-attractiveness-weighting scheme.
Bloomberg Commodity Index: Made up of 22 exchange-traded futures on physical commodities. The index currently represents 20 commodities, which are weighted to account for economic significance and market liquidity.
US Trade-Weighted Dollar Index: A weighted average of the foreign exchange value of the US dollar against a subset of the broad index currencies that circulate widely outside the US.
MSCI Emerging Markets Currency Index: sets the weights of each currency equal to the relevant country weight in the MSCI Emerging Markets Index.
Bloomberg US Aggregate Index: The US Aggregate Index covers the dollar-denominated investment-grade fixed-rate taxable bond market, including Treasuries, government-related and corporate securities, MBS pass-through securities, asset-backed securities, and commercial mortgage-based securities. These major sectors are subdivided into more specific sub-indices that are calculated and published on an ongoing basis. Total return comprises price appreciation/depreciation and income as a percentage of the original investment. This index is rebalanced monthly by market capitalization.
Bloomberg US Corporate High Yield Bond Index: This index is composed of fixed-rate, publicly issued, non-investment grade debt.
S&P Sector Performance
The S&P 500 Consumer Discretionary sector comprises those companies included in the S&P 500 that are classified as members of the consumer discretionary sector.
The S&P 500 Consumer Staples sector comprises those companies included in the S&P 500 that are classified as members of the consumer staples sector.
The S&P 500 Energy sector comprises those companies included in the S&P 500 that are classified as members of the energy sector.
The S&P 500 Financials sector comprises those companies included in the S&P 500 that are classified as members of the financial sector.
The S&P 500 Health Care sector comprises those companies included in the S&P 500 that are classified as members of the health care sector.
The S&P 500 Industrials Sector comprises those companies included in the S&P 500 that are classified as members of the industrials sector.
The S&P 500 Information Technology Sector comprises those companies included in the S&P 500 that are classified as members of the information technology sector.
The S&P 500 Materials Sector comprises those companies included in the S&P 500 that are classified as members of the materials sector.
The S&P 500 Communications Services Sector comprises those companies included in the S&P 500 that are classified as members of the telecommunications services sector.
The S&P 500 Utilities Sector comprises those companies included in the S&P 500 that are classified as members of the utilities sector.
The S&P 500 Real Estate Sector comprises those companies included in the S&P 500 that are classified as members of the real estate sector.
US Equity Style Performance
Weekly and monthly style performance charts use Russell 1000, Russell Mid Cap, and Russell 2000 style indexes to represent large cap, mid cap, and small cap respectively.
Russell 1000: Consists of the 1000 largest companies within the Russell 3000 index. Also known as the Market-Oriented Index, because it represents the group of stocks from which most active money managers choose. The returns we publish for the index are total returns, which include reinvestment of dividends. Frank Russell Company reports its indexes as one-month total returns.
Russell 1000 Growth: Market-capitalization weighted index of those firms in the Russell 1000 with higher price-to-book ratios and higher forecasted growth values. The Russell 1000 includes the largest 1000 firms in the Russell 3000, which represents approximately 98% of the investable US equity market.
Russell 1000 Value: Market-capitalization weighted index of those firms in the Russell 1000 with lower price-to-book ratios and lower forecasted growth values. The Russell 1000 includes the largest 1000 firms in the Russell 3000, which represents approximately 98% of the investable US equity market.
Russell 2000: Consists of the smallest 2000 companies in the Russell 3000 Index, representing approximately 7% of the Russell 3000 total market capitalization. The returns we publish for the index are total returns, which include reinvestment of dividends.
Russell 2000 Growth: Market-weighted total return index that measures the performance of companies within the Russell 2000 Index having higher price-to-book ratios and higher forecasted growth values. The Russell 2000 Index includes the 2000 firms from the Russell 3000 Index with the smallest market capitalizations. The Russell 3000 Index represents 98% of the of the investable US equity market.
Russell 2000 Value: Market-weighted total return index that measures the performance of companies within the Russell 2000 Index having lower price-to-book ratios and lower forecasted growth values. The Russell 2000 Index includes the 2000 firms from the Russell 3000 Index with the smallest market capitalizations. The Russell 3000 Index represents 98% of the of the investable US equity market.
Russell Midcap: Measures the performance of the 800 smallest companies in the Russell 1000 Index, which represent approximately 25% of the total market capitalization of the Russell 1000 Index. As of the latest reconstitution, the average market capitalization was approximately $4.0 billion; the median market capitalization was approximately $2.9 billion. The largest company in the index had an approximate market capitalization of $12 billion.
Russell Midcap Growth: Market-weighted total return index that measures the performance of companies within the Russell Midcap Index having higher price-to-book ratios and higher forecasted growth values. The Russell Midcap Index includes firms 201 through 1000, based on market capitalization, from the Russell 3000 Index. The Russell 3000 Index represents 98% of the of the investable U.S. equity market.
Russell Midcap Value: Market-weighted total return index that measures the performance of companies within the Russell Midcap Index having lower price-to-book ratios and lower forecasted growth values. The Russell Midcap Index includes firms 201 through 1000, based on market capitalization, from the Russell 3000 Index. The Russell 3000 Index represents 98% of the of the investable U.S. equity market.
P/E Relative to Rest of World
TOPIX: This free-floated-adjusted index tracks all domestic companies of the exchange’s First Section.
US Fixed Income Valuation
ICE BofAML Option Volatility Estimate Index (MOVE): A yield curve-weighted index of the normalized implied volatility on one-month treasury option.
An investment cannot be made directly in a market index.