Moment of truth for market pivot?
- After 2.7% down week, the SPX rallied 2.5% last week
- Pattern has been followed by net-bullish (but mixed) returns
- Performance week after pattern a differentiator?
This week’s headlines will likely revolve around earnings and IPOs, but when the dust has settled on Friday, some traders may look past the debate over the “AI trade” and simply note whether the S&P 500 (SPX) closed higher or lower than it did on November 13.
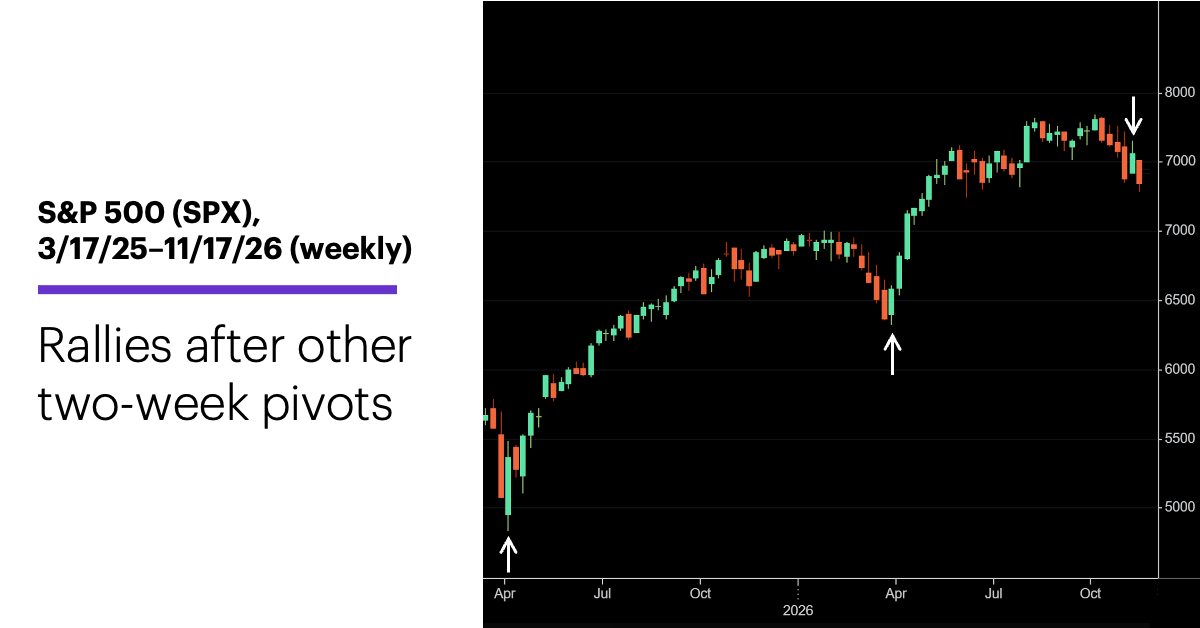
The reason this week’s close could have added significance is the two-week pattern that preceded it. Last week the S&P 500 (SPX) climbed 2.5%, reversing most of the previous week’s 2.7% decline, when the index fell to its lowest weekly close since June 26:
Source (data): Power E*TRADE Pro. (For illustrative purposes. Not a recommendation. Note: It is not possible to invest directly in an index.)
The chart also highlights the two most recent times the SPX made similar moves. Since 1957, such two-week “pivot patterns”—a 2.5% (or larger) weekly decline that also made a 19-week (or longer) low close, followed by 2.5% (or larger) weekly gain—were followed by:
1. After one week, the SPX was higher 21 of 39 times (54%), with a median return of 0.4% (but an average return of -0.1%).
2. After four weeks, the SPX was higher 24 of 39 times (61.5%), with a median return of 1.5%.1
These returns are roughly in line with the SPX’s benchmark performance for all one- and four-week moves since 1957:
1. The SPX posted positive one-week returns 56.5% of the time, with a median return of 0.3%.
2. The SPX posted positive four-week returns 61% of the time, with a median return of 1.1%.
In other words, the composite move implied by all the two-week pivot patterns was comparable to the SPX’s “typical” one- and four-week historical moves. One minor, but notable, exception: The average one-week return after the pivot patterns was negative, suggesting the index sometimes experienced relatively sharp losses, even though it closed up more often than down.
So, are the rallies that followed the first two pattern examples in the chart above unusual, or was there additional information that may have suggested the potential for additional upside?
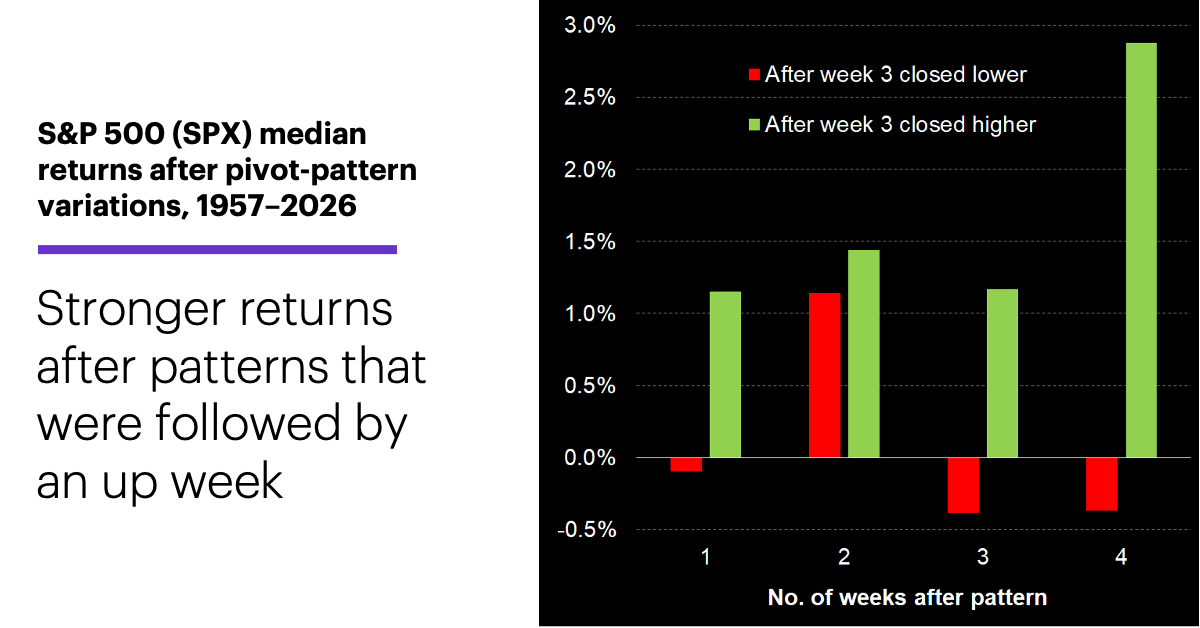
Yes and no. Of the 39 two-week pivot patterns, 21 were followed by up weeks and 18 were followed by down weeks. The following chart shows a notable difference in the SPX’s performance over the next four weeks, depending on whether the SPX closed up (green columns) or down (red columns) the week after the initial two-week pivot pattern:
Source (data): Power E*TRADE Pro. (For illustrative purposes. Not a recommendation. Note: It is not possible to invest directly in an index.)
When the SPX closed higher the week after the pivot pattern, the median return was positive at each interval (although it contracted from week 2 to week 3). By contrast, when it closed lower the week after the pivot pattern, the median return was negative at every interval except week 2. And aside from week 2, the SPX didn’t close higher (that is, above the close of the second week of the pivot pattern) more than half the time.
However, in the first chart, the 2025 two-week pivot pattern was followed by a down week, while the 2026 example was followed by an up week. The SPX staged significant rallies in both cases, so the fact that the week after the two-week pivot pattern was a down week doesn’t mean the market is locked into further losses.
That said, historically, the market has performed better when the week closes higher—which is why many traders may be looking to this Friday’s SPX close to gauge the market’s potential near-term momentum.
Market Mover Update: On Tuesday, the market may have sent a potential momentum signal on the daily time frame. The SPX closed lower than it did on November 5, but the Cboe Volatility Index (VIX) also closed lower than it did that day—signaling the options market was less concerned about future volatility even though the market fell to a lower low (see “Keeping tabs on the VIX”).
Today’s numbers include (all times ET): mortgage applications (7 a.m.), Housing Starts and Building Permits (8:30 a.m.), Pending Home Sales Index (10 a.m.), EIA Petroleum Status Report (10:30 a.m.), FOMC minutes (2 p.m.).
Today’s earnings include: Lowe’s (LOW), Ross Stores (ROST), Target (TGT), TJX (TJX).
Click here to log on to your account or learn more about E*TRADE's trading platforms, or follow the Company on X (Twitter), @ETRADE, for useful trading and investing insights.
1 All figures reflect S&P 500 (SPX) weekly closing prices, 1957-2026. The “two-week pivot pattern” represents: 1) a week the SPX closes at its lowest weekly close in at least 19 weeks and closes 2.5% below the previous week’s close, followed immediately by 2) a week that closes at least 2.5% higher. Supporting document available upon request.