Short-term midterm momentum
- S&P 500 down slightly four days after midterms
- Short-term post-election returns typically positive
- Divided government hasn’t been a headwind
Today will mark one week since the midterm election that was followed by the US stock market’s biggest volatility surge since March.
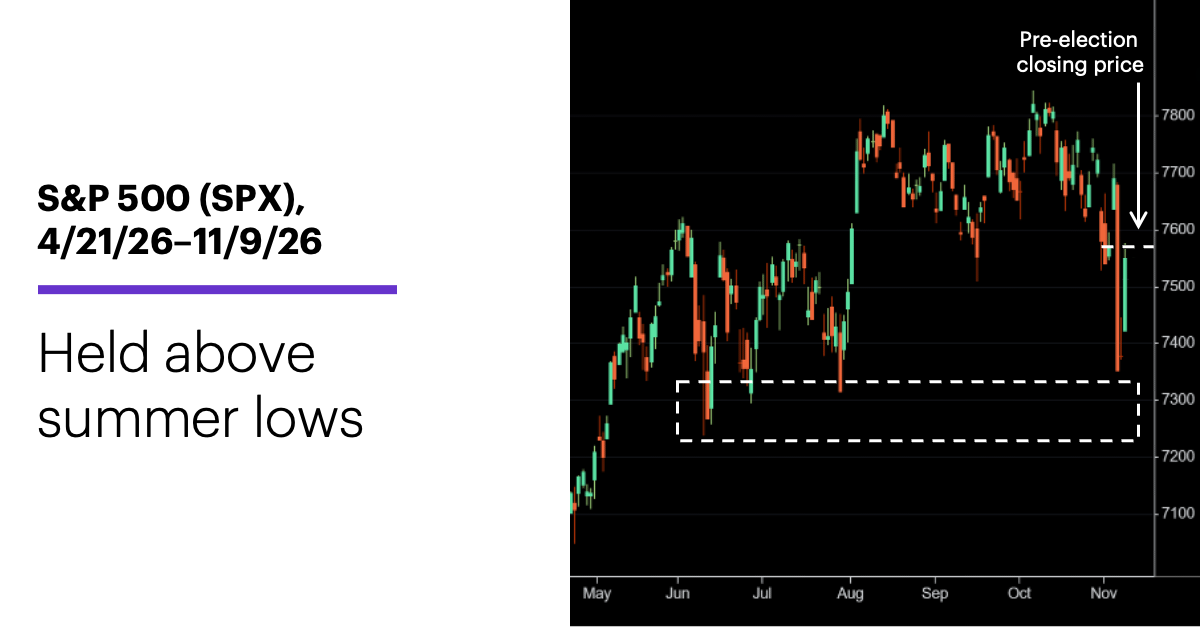
As unsettling as last week’s volatility may have been, at last Thursday’s low, the S&P 500 (SPX) was only 6% below its all-time high and hadn’t quite pulled back to its June-July lows, which essentially represent the lower end of a broad, choppy, five-month consolidation:
Source: Power E*TRADE. (For illustrative purposes. Not a recommendation.)
While Morgan Stanley & Co. analysts acknowledged last week that a change in congressional control can act as a headwind to stocks, they also noted that since 1982 large-cap stocks have gained roughly 15% on a cap-weighted basis in the six months after midterms.1 Meanwhile, Morgan Stanley Wealth Management strategists argued this week that although they “agree that elections have implications, we strongly believe that the bull case remains intact.”2 And as Morgan Stanley & Co. strategists pointed out, one reason stocks have generally traded well in the six to 12 months after midterms is that they often trade poorly into the event.2
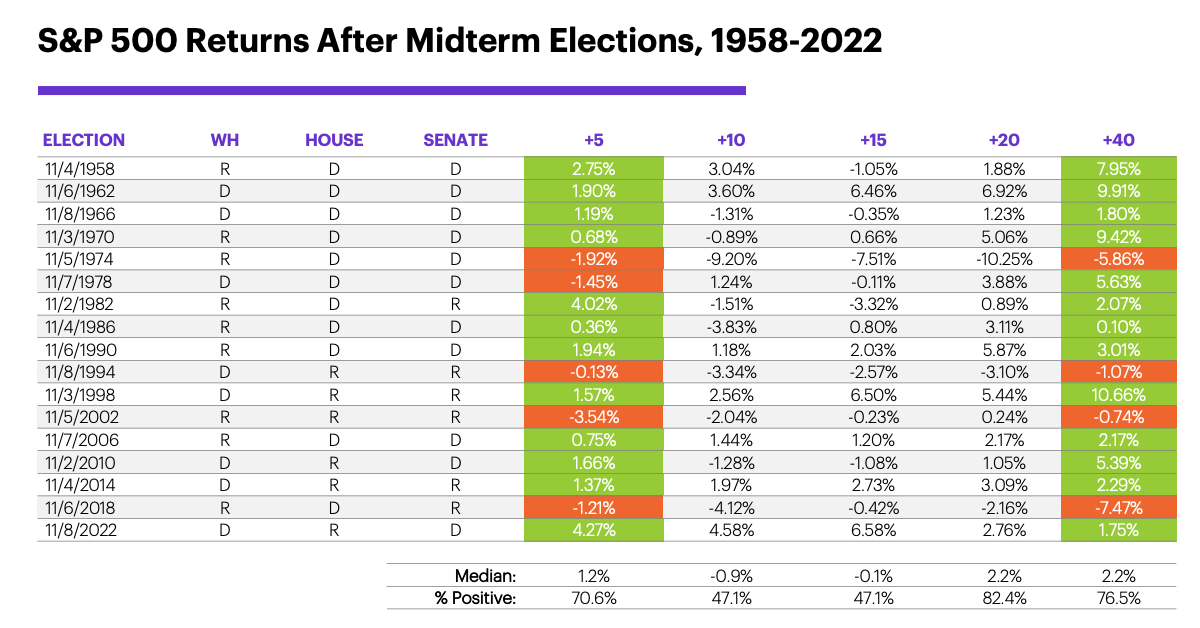
The following table looks at things from a shorter-term perspective—the SPX’s returns from one week to roughly two months (five to 40 trading days) after each midterm since 1958. It also shows the political party (R or D) controlling the White House (WH) at the time of the election, and which party controlled each branch of Congress as a result of the election:
Source (data): Power E*TRADE Pro. (For illustrative purposes. Not a recommendation.)
Quick takeaways:
•After five trading days the SPX had a positive return in 12 of 17 cases and a 1.2% median return.
•After 10 trading days the SPX had a negative return in nine of 17 cases and a -0.9 median return. (After 15 trading days, the median return was still negative, but not by as much.)
•After 20 trading days the SPX had a positive return in 14 of 17 cases and a 2.2% median return.
•After 40 trading days the SPX had a positive return in 13 of 17 cases and a 2.2% median return.
The performance at both the five- and 40-day intervals is stronger than the index’s long-term benchmarks. For example, since 1957 the SPX has rallied in 56.6% of all five-day periods and has a median return of 0.2%, while those figures are 63.8% and 1.8%, respectively, for all 40-day periods. Overall, the market has tended to perform better than average one to two months after midterms (which jibes with its longer-term post-election strength), despite a bias toward pulling back after the initial (five-day) rally.
However, because midterms occur only every four years, our sample size is unavoidably small, which makes the statistics it produces less reliable—especially when breaking down the results into smaller components. That said, one thing traders might notice is that when the SPX’s post-midterm return was negative after five days, it was still negative after 40 days in four of five instances, and the index had fallen further in three instances. (If the SPX closes above 7,568.92 today, it will have a positive five-day, post-midterm return.)
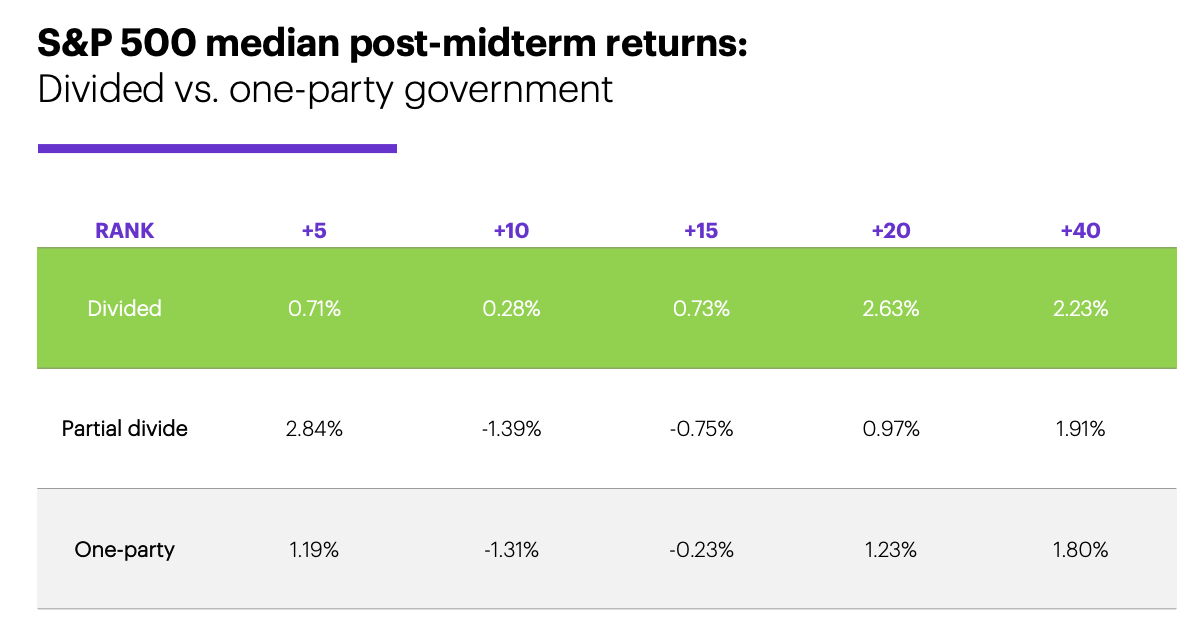
The table below breaks down the post-midterm performance in terms of whether the results produced a divided, partially divided, or one-party government. Here, “divided” refers to one party controlling the White House while the other controls both branches of Congress, “partial divide” refers to the opposition party controlling either the House or the Senate, and “one party” means Republicans or Democrats control both the White House and both branches of Congress:
Source (data): Power E*TRADE Pro. (For illustrative purposes. Not a recommendation.)
Again, the small number of examples suggests we shouldn’t read too much into the results (one-party government after a midterm has occurred only three times since 1957, for example), but the numbers align with statistics showing divided government tends to benefit the stock market over longer periods. After 20 and 40 trading days, returns after divided-government outcomes were stronger than those following one-party or partially divided governments.
Two final observations: First, the SPX’s six-month return was larger than its 40-day return after all 17 midterms. Second, those six-month returns have gotten smaller in recent decades. Between 1958 and 1990, eight of nine six-month post-midterm returns were 10% or larger. Since then, only three of seven met that threshold.4
Market mover update: December WTI crude oil futures (CLZ6) kicked off the week by falling more than 4%.
Today’s numbers include (all times ET): NFIB Business Optimism Index (6 a.m.), Consumer Price Index (8:30 a.m.).
Today’s earnings include: CoreWeave (CRWV), Cisco (CSCO).
Click here to log on to your account or learn more about E*TRADE's trading platforms, or follow the Company on X (Twitter), @ETRADE, for useful trading and investing insights.
1 MorganStanley.com. Midterm Election Results: Decisive for Democrats. 11/4/26.
2 MorganStanley.com. Weekly Warm-up: Buy the Rumor, Sell the News. 11/9/26.
3 MorganStanley.com. Market Update from Lisa Shalett, Chief Investment Officer of Morgan Stanley Wealth Management. 11/9/26.
4 All figures reflect S&P 500 (SPX) daily closing prices, 1957-2026. Supporting document available upon request.