Keeping tabs on the VIX
- The VIX surged during last week’s stock sell-off
- VIX and SPX typically have inverse relationship
- Exceptions to that rule may signal potential reversals
When the S&P 500 (SPX) tumbled more than 4% on November 5 to its lowest low since late July, the Cboe Volatility Index (VIX) did what it was “supposed” to do, jumping to its highest close since March:
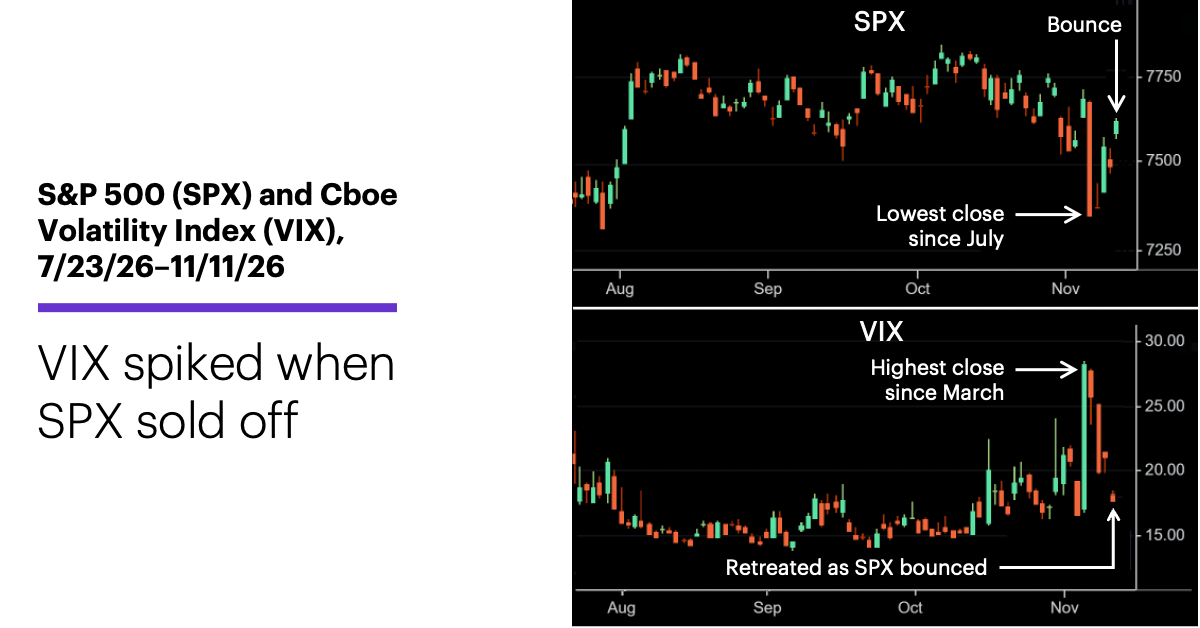
Source: Power E*TRADE. (For illustrative purposes. Not a recommendation.)
The reason that behavior was on brand is that the VIX reflects the implied volatility (IV) of SPX options, and IV represents the options market’s expectations for future volatility. And those expectations typically increase when the SPX falls—especially when it falls sharply.
That’s why the SPX and VIX generally have an inverse relationship. A rising stock market is usually accompanied by falling and/or low VIX readings (reflecting less concern about future volatility), while a declining market typically produces rising and/or high VIX readings (reflecting greater concern about future volatility). Notice the VIX pulled back as the SPX bounced after the sell-off (except on Tuesday when the SPX closed lower). If the SPX had instead extended its sell-off, most observers would have—correctly—expected the VIX to continue to rise.
Understanding what the VIX typically does makes it important to pay attention when it behaves out of character—for instance, when it goes down instead of up when the SPX sells off. While no one knows whether last Thursday will mark a shorter-term or longer-term low, the VIX may provide a potentially useful signal in the event the SPX falls below it in the relatively near future.
The chart below shows how. When the SPX fell to a six-week low on December 18, 2024, the VIX closed at its highest level in more than four months (1). When the SPX closed down the next day (2), the VIX—instead of closing higher, as one might expect—also closed lower, suggesting the options market was “less anxious” even though the stock market was still falling. That was followed by a three-day bounce:
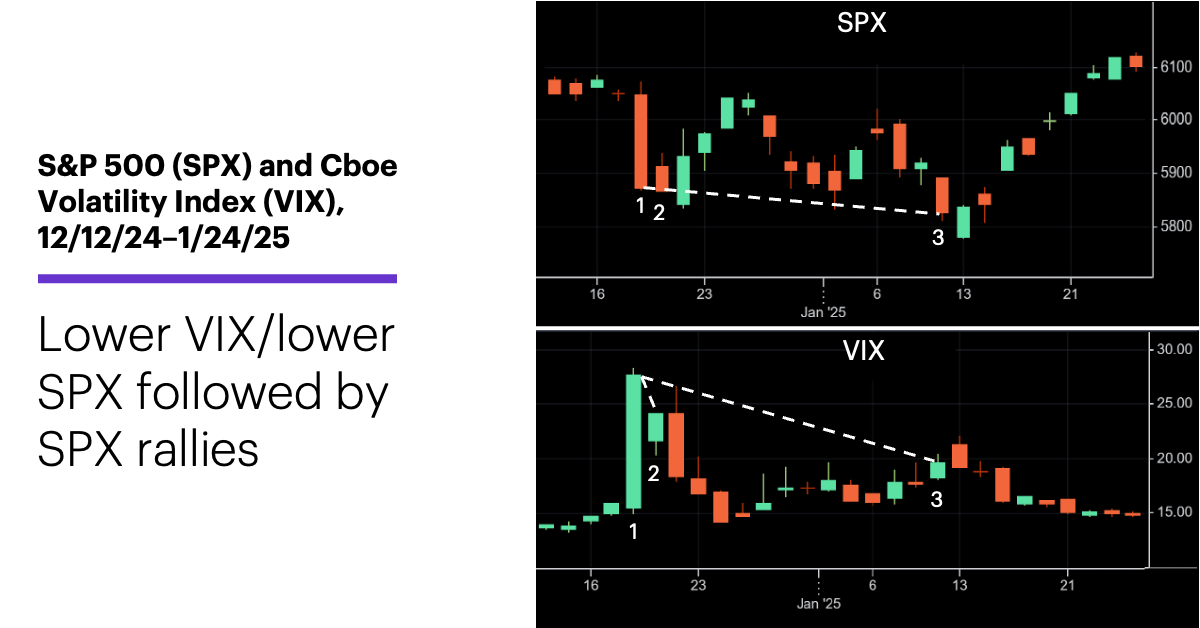
Source (data): Power E*TRADE Pro. (For illustrative purposes. Not a recommendation.)
The pattern repeated itself a couple of weeks later. On January 10 when the SPX closed lower than it had on either December 18 or 19, the VIX also closed lower than it had on either of those days—again, signaling less “concern” about volatility even though the market had fallen to a lower level. This was followed by a nearly two-week, 5% rebound, and the SPX remained above its January 10 close for more than seven weeks.
Bulls are certainly hoping the market doesn’t bother to test last week’s low. But if the SPX does close below last Thursday’s close in the near future, the VIX's level—whether it's higher or lower than it was on that day—may send a signal about sentiment and the potential trajectory of the market.
The stock market often tests notable sell-off lows. The VIX can sometimes help indicate whether it is more or less likely to pass the test.
Today’s numbers include (all times ET): weekly jobless claims (8:30 a.m.), Existing Home Sales (10 a.m.).
Today’s earnings include: Applied Materials (AMAT), Cerebras (CBRS), Inhibrx Biosciences (INBX), Yeti (YETI).
Click here to log on to your account or learn more about E*TRADE's trading platforms, or follow the Company on X (Twitter), @ETRADE, for useful trading and investing insights.