Market cautious ahead of inflation data
- Indexes rise modestly as oil prices and yields climb
- Market appears wary of jobs-report strength
- This week: inflation (CPI and PPI)
For much of last week the US stock market appeared willing to shrug off renewed US-Iran military exchanges, rising oil prices, and stubbornly high long-term Treasury yields. But a “good-news-is-bad” reaction to strong labor-market data left most of the major indexes with modest gains for the week.
Although S&P 500 (SPX) rebounded from a Monday-Tuesday pullback to close Thursday at a three-week high, it sagged Friday as a surprise jump in payrolls appeared to fuel concerns that the Fed would be more inclined to hike interest rates:
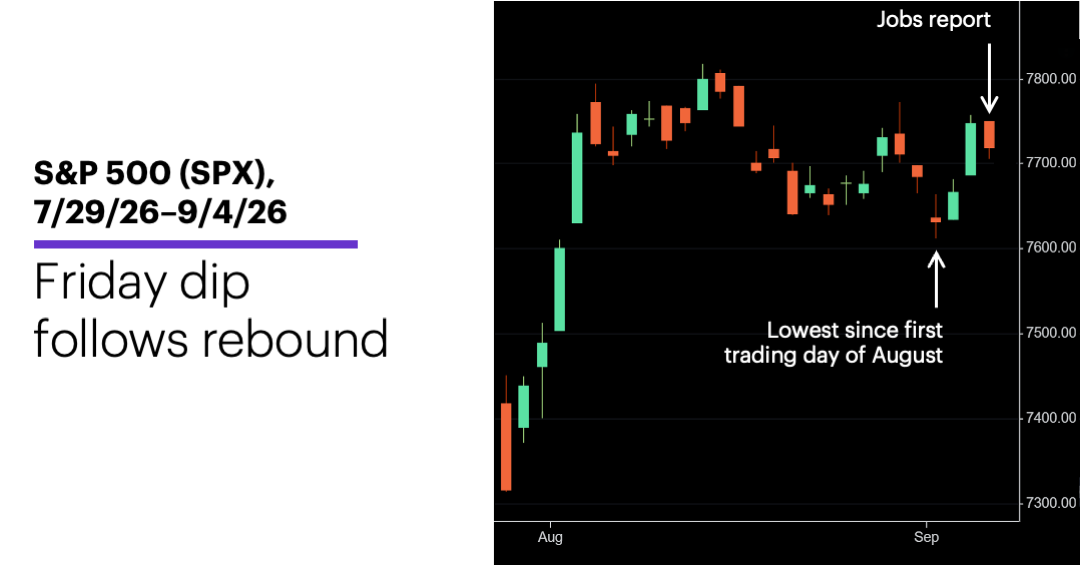
Source: Power E*TRADE. (For illustrative purposes. Not a recommendation. Note: It is not possible to invest in an index.)
The headline: Market choppy with inflation in spotlight.
The fine print: Despite the negative initial reaction the jobs report, the payrolls increase was actually in line with its longer-term average and the unemployment rate was unchanged at 4.1%. According to Ellen Zentner, Chief Economic Strategist for Morgan Stanley Wealth Management, next week’s inflation numbers are what matter: “If those come in cooler than expected, the Fed will likely feel comfortable discounting potentially inflationary signals coming out of the labor market.”
The move: The PHLX Semiconductor Index’s (SOX) 3.4% Friday rally. The strong AI/chip rally—keyed by several “memory” and storage names like Sandisk (+11.2%), Micron (+5.7%), Seagate (+6.3%), and Western Digital (+5.8%)—helped curb losses in the SPX and buoyed the Nasdaq 100 (NDX) tech index.
The scorecard: The NDX led the market last week:
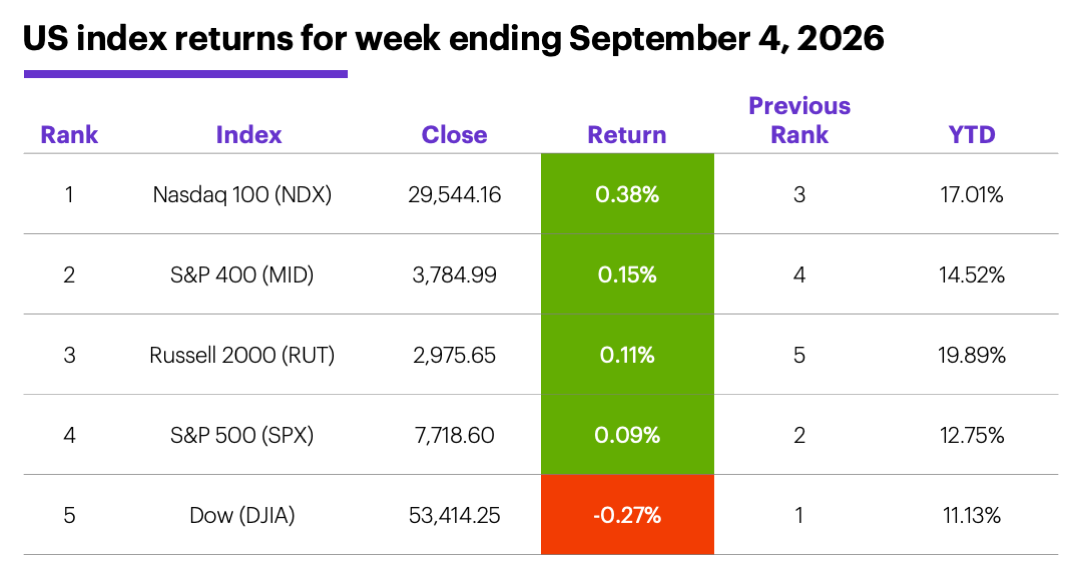
Source (data): Power E*TRADE. (For illustrative purposes. Not a recommendation.)
S&P 500 sector returns: The strongest S&P 500 sectors last week were industrials (+0.4%), information technology (+0.2%), and utilities (+0.04%). The weakest sectors were consumer discretionary (-1.3%), health care (-1%), and energy (-1%).
S&P 500 stock movers: Last week’s biggest gains were Sandisk (SNDK) +17% to $1740, Robinhood (HOOD) +17% to $122.11, and Dell (DELL) +15% to $524.14. The biggest losses were Fair Isaac (FICO) -19% to $932.26, Edison International (EIX) -19% to $56.77, and Lululemon (LULU) -17% to $100.61.
Yields and the dollar: Despite a sharp pullback last Thursday, 10-year US Treasury yield climbed 0.05% to 4.78% for the week. The US Dollar Index (DXY) fell 0.52 to 99.18.
Commodity futures: October WTI oil (CLV6) ended the week up $8.08 at $91.48, as spot oil prices hit their highest level since July 23. December gold (GCZ6) fell $53.30 to $4,476.60. Biggest gains: October WTI crude oil (CLV6) +9.7%, November orange juice (OJX6) +7.7%. Biggest declines: December cocoa (CCZ6) -6.9%, September Lithium (LTHU6) -6.4%.
Crypto: Bitcoin climbed 2.4% to $79,671.97, Ethereum rose 0.6% to $2,456.08.
Coming this week
This week brings the last inflation readings before the Fed’s September policy meeting:
●Tuesday: NFIB Business Optimism Index, Consumer Inflation Expectations, Consumer Credit
●Thursday: Producer Price Index (PPI), Existing Home Sales, Wholesale Inventories
●Friday: Consumer Price Index (CPI), Consumer Sentiment (preliminary)
This week’s earnings include:
●Tuesday: ABM Industries (ABM), Braze (BRZE), Casey’s General Stores (CASY), United Natural Foods (UNFI)
●Wednesday: American Eagle Outfitters (AEO), AeroVironment (AVAV), National Beverage (FIZZ), RH (RH), SailPoint (SAIL)
●Thursday: Adobe (ADBE), Designer Brands (DBI), Macy's (M)
●Friday: Kroger (KR)
Post-Labor Day trading
While economic data and geopolitical developments will likely play a more important role in shaping this week’s market action, the shortened week after Labor Day has demonstrated a modest seasonal bias—specifically, it’s tended to be a softer-than-average patch for US stocks, although in line with the month’s net weakness.
Over the past 69 years, Tuesday and Thursday have been down days for the SPX 54% and 52% of the time, respectively, while Wednesday and Friday have been up days 51% and 55% of the time, respectively. As a whole, the four-day stretch has been negative 54% of the time, with a median return of -0.3%.
A twist: This year, Labor Day week spans trading days 5-8 of September—which, as “Digging into September” shows, has been one of the more net-bullish portions of the month over the past 35 years.
Click here to log on to your account or learn more about E*TRADE's trading platforms, or follow the Company on X (Twitter), @ETRADE, for useful trading and investing insights.
1 All figures reflect S&P 500 (SPX) daily closing prices, 1957-2025. Supporting document available upon request.