The expectations trap
- HQY fell 15% intraday after announcing earnings
- Company topped headline numbers, gave in-line guidance
- Sell-off pattern sometimes followed by short-term volatility
While NVIDIA (NVDA) understandably dominated much of the stock market discussion early Thursday, it wasn’t the only stock reacting to earnings. And one of the stocks it overshadowed, HealthEquity (HQY), may have had a more interesting story to tell.
Before the opening bell on Thursday, HQY released the following numbers:
Earnings: $1.24 (vs. $1.19 estimate)
Revenue: $350.73 million (vs. $349.22 million estimate)
Forward guidance: full-year earnings of $4.66-$4.73 (vs. $4.72 estimate), and full-year revenue of $1.41-$1.42 billion (vs. $1.41 billion estimate)1
In addition to beating estimates, the Q2 earnings and revenue numbers were HQY’s highest and second-highest, respectively, since the stock began trading publicly in 2014. Even so, HQY fell more than 15% intraday (hitting its lowest level since early July), and eventually closed down more than 10%—it’s first double-digit percentage loss since April:
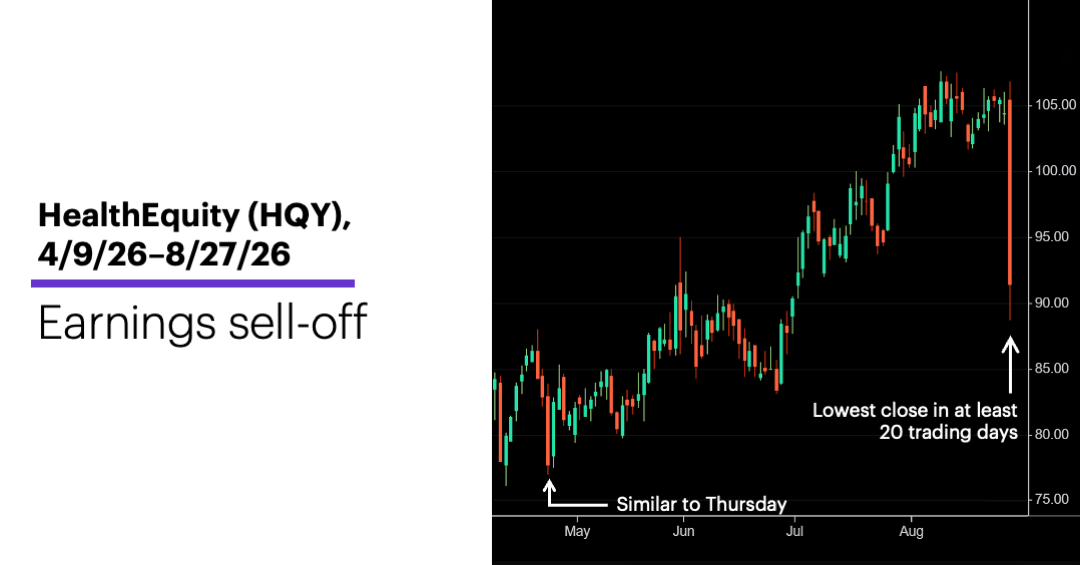
Source: Power E*TRADE. (For illustrative purposes. Not a recommendation.)
Why the sell-off? Some traders may describe the company’s forward guidance as “disappointing,” but given the estimates for both full-year earnings and revenue were within the respective ranges the company provided, they could just as easily be described as “in line.”
That, perhaps, is the heart of the matter—perception. Approaching the end of what has been, by almost any measure, an impressive reporting season, a simple earnings “beat” may not satisfy a market that has grown accustomed to outperformance. While disappointing forward guidance has always had the ability to undermine estimate-topping headline numbers, increasingly lofty expectations may make stocks more vulnerable to earnings sell-offs even if they top their numbers and issue better-than-expected forward guidance—if they don’t top them by “enough.”
Whether such disappointments and earnings sell-offs are more likely to be short-term opportunities or potentially longer-term disruptions is a separate issue, and one that can only be addressed on a case-by-case basis.
And in his case, there are very few direct precedents. Thursday was one of the 20-largest down days in HQY’s history. The stock has closed down 10% or more just 16 other times, and only 13 of those occurred when the stock also closed at its lowest level at least 20 trading days, as it did on Thursday.2
That’s too few examples to provide reliable statistics, but anecdotally, the performance after them suggests HQY a tendency toward continued volatility over the next five trading days, followed by stronger performance in the five days after that. A wider group (53 examples) of similar moves—5% (or larger) down days that also set a 20-day (or longer) low—shows a similar tendency:
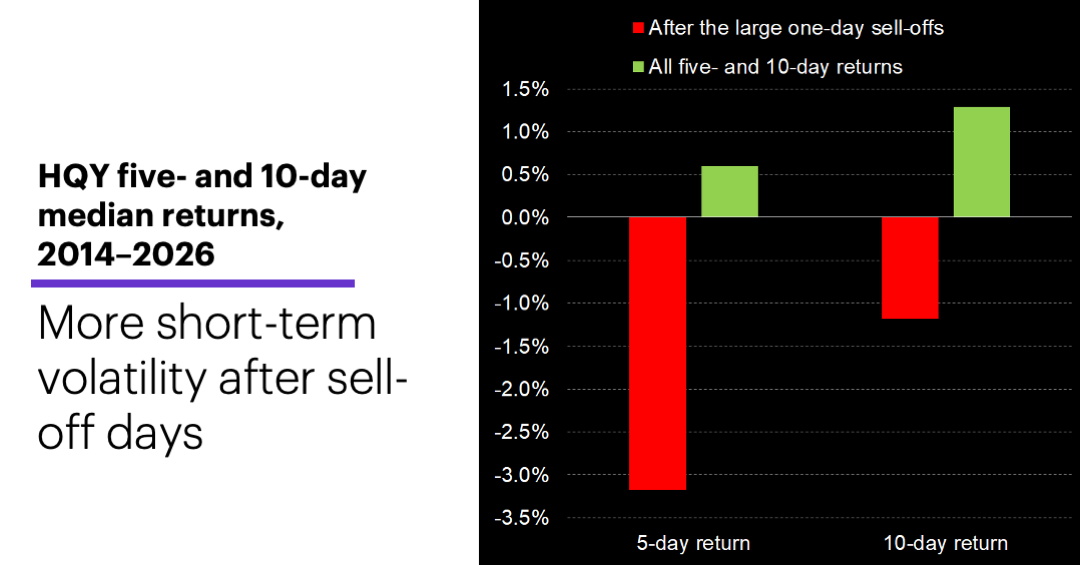
Source: Power E*TRADE Pro. (For illustrative purposes. Not a recommendation.)
This chart compares the five-, 10-, and 20-day median returns after the large down days (red) to the median returns for all five-, 10-, and 20-day periods in HQY’s history (green). The stock’s median five-day return after the sell-off days was -3.2%, but that loss shrank to -1.2% after 10 trading days, which means the median return was positive from day five to day 10.
Today’s numbers include (all times ET): Chicago PMI (9:45 a.m.), Consumer Sentiment (10 a.m.), Fed Chair Kevin Warsh speaks at Jackson Hole Symposium (10 a.m.).
Today’s earnings include: Frontline (FRO).
Click here to log on to your account or learn more about E*TRADE's trading platforms, or follow the Company on X (Twitter), @ETRADE, for useful trading and investing insights.
1 StreetInsider. HealthEquity (HQY) Tops Q2 EPS by 5c; Offers Guidance. 8/27/26.
2 All figures reflect HealthEquity (HQY) daily prices, 2014-2026. Supporting document available upon request.