Stocks mixed into month-end
- Tech leads as SPX makes another run at record highs
- Treasury yields and oil prices swing, gold pulls back
- This week: jobs report, more tech earnings
Bouncing back from its first pullback in a month, the US stock market closed out the final full week of August with a gain amid high-profile earnings and messaging from a Fed that claims not to like messaging. US-Iran military exchanges over the weekend renewed geoopolitical uncertainty and sent oil prices climbing.
After a choppy first few days of the week, the S&P 500 (SPX) made a solid push higher last Thursday as strong earnings from NVIDIA (NVDA) helped boost the tech sector. But the market surrendered an early-Friday rally, perhaps digesting Fed Chair Kevin Warsh’s seemingly hawkish speech at the Jackson Hole Economic Symposium:
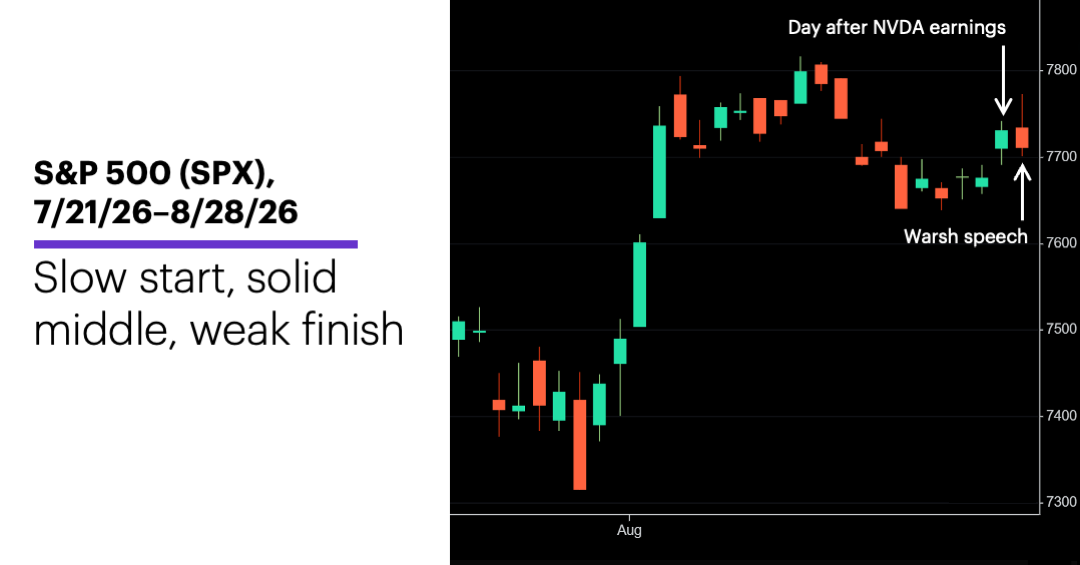
Source: Power E*TRADE. (For illustrative purposes. Not a recommendation. Note: It is not possible to invest in an index.)
The headline: Tech drives late-August bounce.
The fine print: While NVIDIA (NVDA) was the focal point of last week’s earnings calendar, Salesforce (CRM) may have been a better representative of the tech sector’s momentum. Both companies released their numbers after Wednesday’s close. NVDA rallied 8.7% on Thursday but pulled back 4.6% on Friday. Software stock CRM rallied more than twice as much as NVDA (22.6%) on Thursday, then climbed 1.6% on Friday. Software was the SPX tech sector’s strongest industry group.
The number: 57.5%, the CME FedWatch Tool’s estimated probability of a September rate hike after Fed Chair Warsh’s Friday speech—up from around 35% a day earlier. Warsh acknowledged inflation was a problem, and that it was the Fed’s responsibility to address it.
The scorecard: The Dow Jones Industrial Average (DJIA) led the market, while the Russell 2000 (RUT) small-cap and S&P 400 (MID) mid-cap indexes slipped for the week:
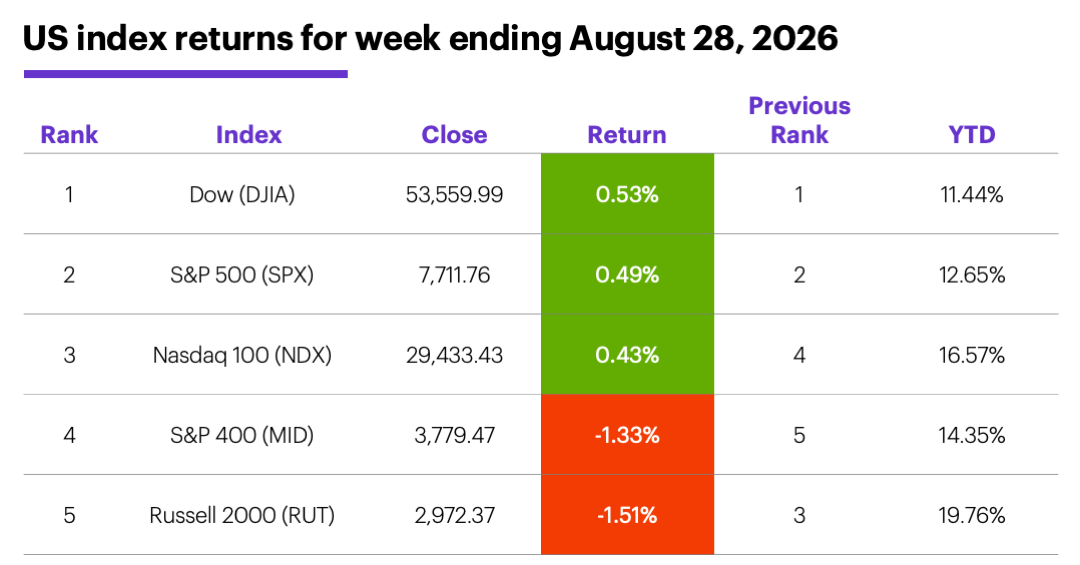
Source (data): Power E*TRADE. (For illustrative purposes. Not a recommendation.)
S&P 500 sector returns: The strongest S&P 500 sectors last week were tech (+1.8%), communication services (+1.6%), and financials (+1%). The weakest sectors were energy (-2.1%), health care (-2.1%), and industrials (-1.7%).
S&P 500 stock movers: Last week’s biggest gains were Salesforce (CRM) +22% to $256, CrowdStrike (CRWD) +14% to $218.40. The biggest losses were PayPal (PYPL) -13% to $53.66, Generac (GNRC) -11% to $183.80. Other moves: Dick’s Sporting Goods (DKS) -31% to $124.31 on Tuesday, Abercrombie & Fitch (ANF) +37% to $147.75 on Wednesday.
Yields and the dollar: Long-term yields retreated last Monday-Tuesday amid reports the Treasury Department intended to expand its buyback program, but the benchmark 10-year Treasury yield rebounded to end the week unchanged at 4.73%. The US Dollar Index (DXY) rose 0.90 to 99.70.
Commodity futures: October WTI crude oil (CLV6) fell $3.66 to $83.40 last week, thanks mostly to a 3.1% Tuesday sell-off. (But prices surged Sunday night into Monday morning as the US and Iran traded military strikes.) A 2.9% Friday drop after Warsh’s Jackson Hole speech left December gold (GCZ6) down $150.70 at $4,529.90 for the week. Biggest gains: December wheat (ZWZ6) +12.1%, December hard red wheat (KWZ6) +10.9%. Biggest losses: November orange juice (OJX6) -6.2%, December Brent crude oil (BZ6) -4.3%.
Coming this week
●Tuesday: ISM Manufacturing Index, Job Openings and Labor Turnover Survey (JOLTS ), Construction Spending
●Wednesday: ADP Private Employment, Factory Orders, Fed Beige Book
●Thursday: Challenger Job Cuts, Balance of Trade JUL, Productivity and Costs, ISM Services Index
●Friday: Jobs Report
The earnings calendar features a healthy dose of notable tech and consumer names:
●Monday: American Eagle Outfitters (AEO), Frontline (FRO)
●Tuesday: Gitlab (GTLB), MongoDB (MDB), Medtronic (MDT), Palo Alto Networks (PANW)
●Wednesday: Argan (AGX), Broadcom (AVGO), Copart (CPRT), Five Below (FIVE), G-III Apparel (GIII), Hewlett Packard Enterprise (HPE), NetApp (NTAP), PVH (PVH), Science Applications (SAIC), Snowflake (SNOW)
●Thursday: Ambarella (AMBA), Campbell's (CPB), Docusign (DOCU), Lululemon Athletica (LULU), UiPath (PATH), Zscaler (ZS)
The September seasonal
It’s that time of year. When market watchers talk about looming “seasonal weakness,” what they’re really referring to is September’s well-cataloged history of stock-market bearishness. Since 1957, it’s the only month with more negative returns than positive ones—up in 30 years and down in 38:
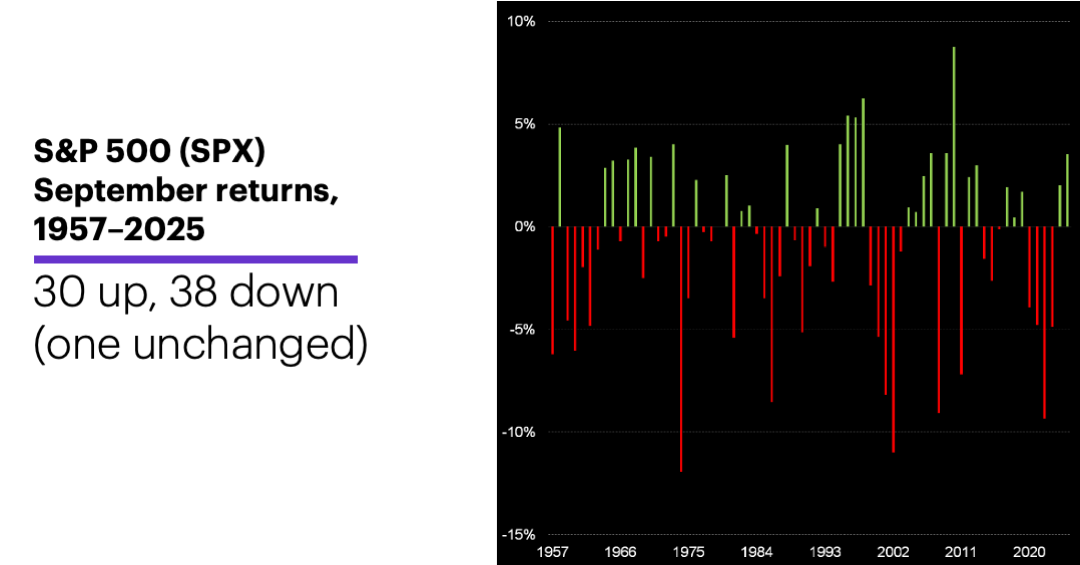
Source (data): Power E*TRADE Pro. (For illustrative purposes. Not a recommendation. Note: It is not possible to invest directly in an index.)
Even over the past three decades, when September was up 16 times and down 15 times, that still amounted to nothing more than a tie (with February) for the lowest number of positive returns.1
The chart shows why September’s average return was negative during this period even though it had one more positive return than negative: Large losses outnumbered large gains. Although all four of September’s 5%-or-larger larger gains have occurred since 1991, that’s still two fewer than the number of 5%-or-larger declines. Since 1957, the SPX has fallen 5% or more in September a total of 12 times, and it’s declined 4% or more 16 times, compared to just six 4%-or-larger declines.
Also, negative Septembers were more common after positive Augusts than negative Augusts. After the 49 positive Augusts since 1957, September was negative 22 times, positive 17 times, and unchanged once (in 1979). After the 29 negative Augusts, September was positive 16 times and negative 13 times.
Finally, given the past two Septembers were positive, it may be worth noting that runs of three or more positive Septembers have occurred only three times, although they’ve clustered in the past 31 years: 1995-1998, 2004-2007, and 2017-2019.
Click here to log on to your account or learn more about E*TRADE's trading platforms, or follow the Company on X (Twitter), @ETRADE, for useful trading and investing insights.
1 All figures reflect S&P 500 (SPX) monthly closing prices, 1957-2025. Supporting document available upon request.