Digging into September
- More up days than down days in September
- Tendency for larger down days has skewed performance
- Weakness more common in second half of month
Tuesday’s S&P 500 (SPX) decline may have seemed “on brand” for the historically weak month of September, but it really wasn’t. Over the past 69 years, the first trading day of September has been positive 39 times, negative 29 times, and unchanged once.1
This seasonal factoid is presented simply to highlight the possibility that September’s long-term underperformance may be misunderstood. Taking an in-depth look at its intramonth performance since 1991—a period that was less bearish than the 34 years that preceded it—helps explain why September has been a net-negative month even though it is far from monolithically bearish.
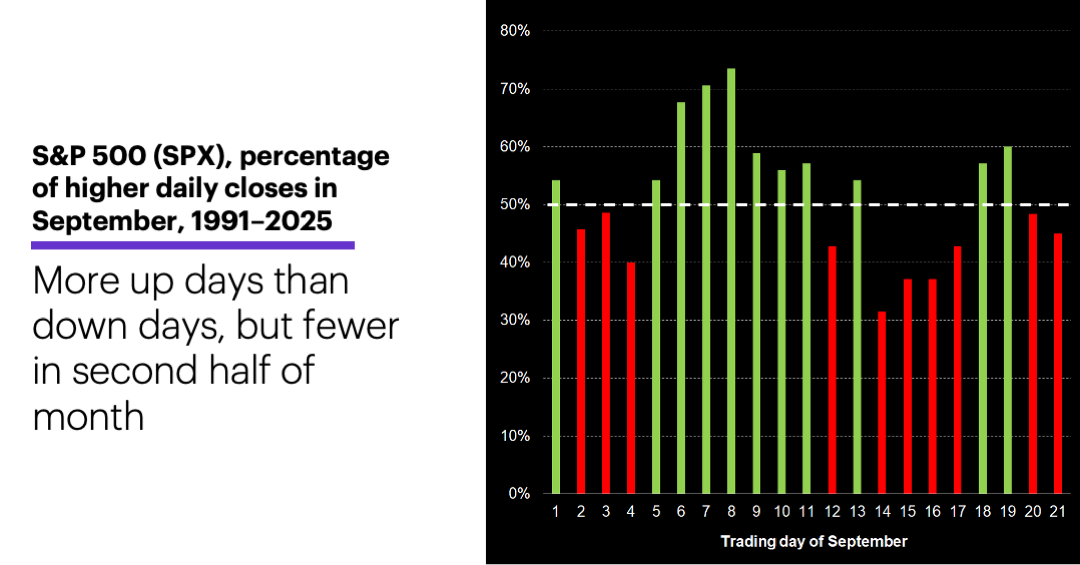
First, let’s start with what may be a surprising aspect of its performance. Calculating the number of times each trading day of September closed up or down since 1991 shows that 11 days closed up more often than down (green), while 10 closed down more often than up (red):
Source: Power E*TRADE. (For illustrative purposes. Not a recommendation.)
The second important takeaway from this chart is that even though there were more days that closed up more often than down, the latter were concentrated in the second half of the month. From day 11 forward, there were seven down days and only four up days.
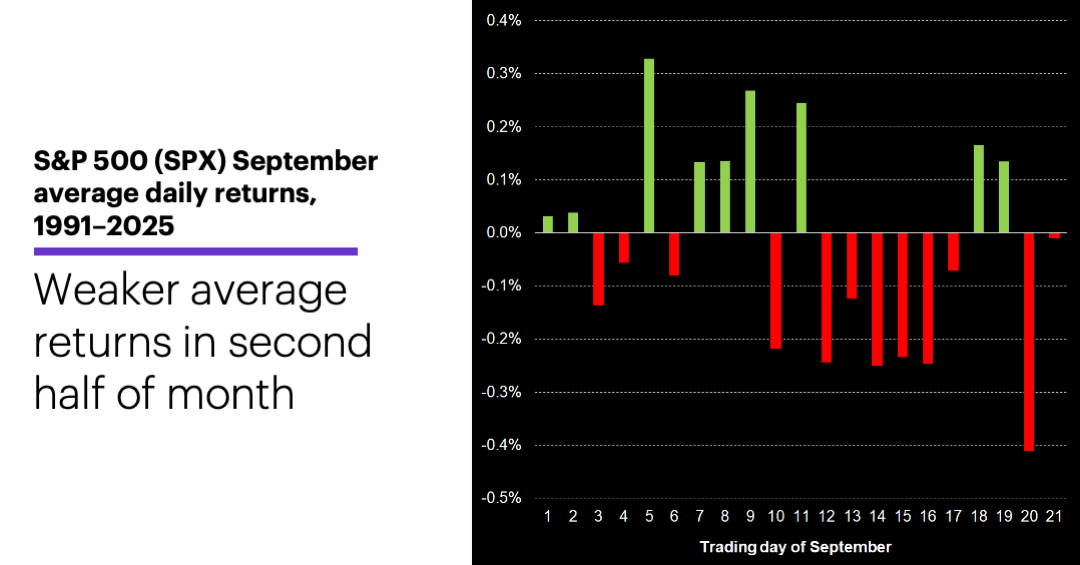
Of course, how frequently a market closes higher or lower is only one part of the equation determining whether it rallies or falls over time. The chart below, which shows the SPX’s average return for each trading day of September, helps explain why the month has been net negative despite having more up-closing days than down-closing days. Again, weakness is more apparent in the second half of the month, but there are also more days with negative average returns (12) than positive average returns (9):
Source: Power E*TRADE Pro. (For illustrative purposes. Not a recommendation.)
There’s an apparent disconnect between the two charts: How can the sixth trading day of the month, for example, have a negative average return when the first chart shows it was an up day more than 70% of the time?
The answer parallels the explanation for September’s net-negative return since 1991 even though it was positive one more time than negative: Larger-than-average losses were more common than larger-than-average gains. The SPX fell an average of -1.5% when the sixth trading day of the month closed lower, but gained an average of only 0.6% when it closed higher. This tendency runs throughout the month, as the chart illustrates: Six days had negative average returns in excess of -0.2%, while only three days had positive average returns larger than +0.2%.
Taking an even broader view, the average return for all September down days since 1991 was -0.8%, while the average for all up days was +0.7%. Similarly, the average return for the 15 biggest down days was -4.2%, while the average for the 15 biggest up days was 3.6%.
These differences in these averages suggest occasional big down days in September have tended to skew its historical performance to the downside. September isn’t always a down month (as the past two years illustrate), but it has established a track record of being the month of the year when bears have roamed a little more freely.
Market Mover Update: Palo Alto Networks (PANW) may have been the latest victim of lofty earnings expectations. The stock fell more than 11% intraday on Wednesday despite beating its headline numbers and topping forward guidance estimates (see “The expectations trap”).
Today’s numbers include (all times ET): job cuts (5:30 a.m.), International Trade in Goods and Services (8:30 a.m.), weekly jobless claims (8:30 a.m.), Productivity and Labor Costs (8:30 a.m.), Fed Governor Christopher Waller speech (8:30 a.m.), ISM Services Index (10 a.m.), EIA Natural Gas Report (10:30 a.m.), Treasury buyback announcement (11 a.m.).
Today’s earnings include: Ambarella (AMBA), Campbell's (CPB), Docusign (DOCU), Lululemon (LULU), UiPath (PATH), Zscaler (ZS).
Note: The Extended Hours Day session has been updated to begin at 4 a.m. ET, Monday through Friday, for most US-listed securities. Eligible symbols can now be traded 4 a.m. to 8 p.m. ET when selecting "EXT (Day Plus Extended Hours)" in the Duration menu. Learn more.
Click here to log on to your account or learn more about E*TRADE's trading platforms, or follow the Company on X (Twitter), @ETRADE, for useful trading and investing insights.
1 All figures reflect S&P 500 daily closing prices, 1991-2025. Supporting document available upon request.