Traders active near support
- GPN down 22% after 33% rebound off April lows
- Put volume more than 50 times avg. on Wednesday
- Small-cap relative strength poised to continue?
Global Payments’ (GPN) quiet trading on Tuesday—the stock closed unchanged on lower-than-average volume—belied some notable activity behind the scenes in its options.
Even though the stock’s decline was fairly mild, Tuesday’s slump nonetheless reflected the stock’s short-term and long-term trends. Although GPN rallied on November 4 after releasing earnings (“E”), it has since fallen as much as 11.3%, extending a near-term breakdown that began in October and setting up a potential test of the April low around $66:
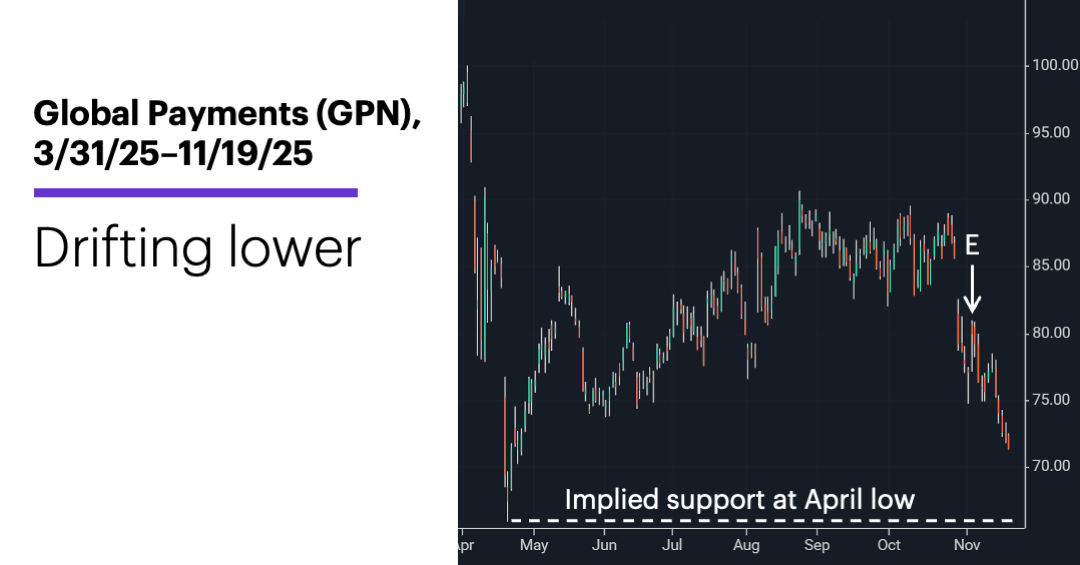
Source: Power E*TRADE. (For illustrative purposes. Not a recommendation.)
That level is likely of great interest to GPN bulls, since it marked the stock’s lowest low in nine years and was the launching pad for a 33% rebound over the next four months.
But the past few months are just a small part of GPN’s momentum story. On April 21, GPN was nearly 70% below its 2021 record close above $219, and had given back nearly two-thirds of the rally off its March 2009 low:
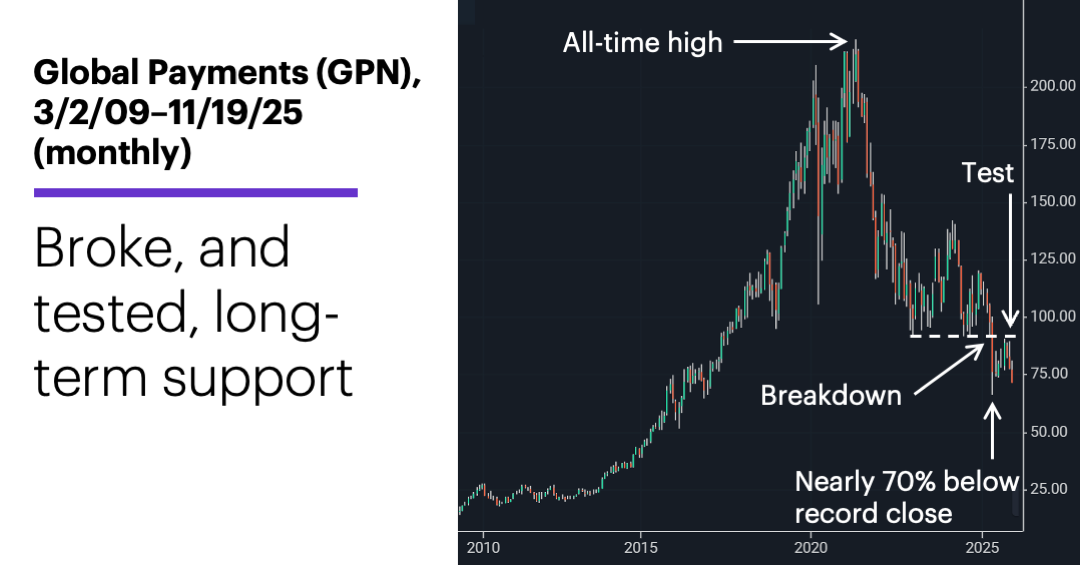
Source: Power E*TRADE. (For illustrative purposes. Not a recommendation.)
This monthly chart shows the April low followed the breakdown of a longer-term support level defined by the late-2022 and mid-2024 lows. The rebound lost momentum when prices tested the former breakdown level in August. In the relatively near term, whether GPN can climb back above that level may depend on whether the April lows hold as support, if the stock falls that low.
Even though traders weren’t doing much in GPN stock on Tuesday, they were quite active in its options—specifically, puts. More than 2,000 contracts traded in the roughly at-the-money December $70 puts, while volume in the out-of-the-money January $60 puts topped 13,000. Overall, put volume was around 52 times average, and more than eight times call volume.
Market Mover Update: Since the March 2009 financial-crisis lows, the S&P 500 (SPX) has outgained the Russell 2000 (RUT) small-cap index by roughly 270 percentage points:
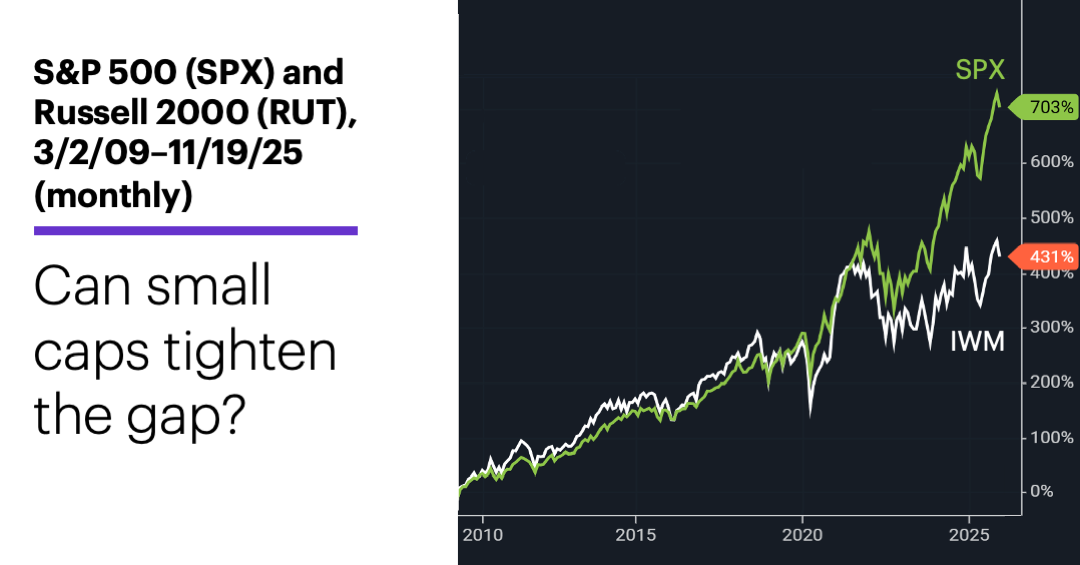
Source: Power E*TRADE. (For illustrative purposes. Not a recommendation.)
While it’s difficult to tell from this chart, the RUT has slightly outperformed the SPX since early April, even though it’s still the weaker performer for the year.
Morgan Stanley & Co. strategists think the improving fortunes of small caps may not be a fluke. In their recently published 2026 US equity outlook, the analysts upgraded small caps to Overweight for the first time since 2021.
Today’s numbers include (all times ET): Employment Report (8:30 a.m.), weekly jobless claims (8:30 a.m.), Philadelphia Fed Manufacturing Index (8:30 a.m.), existing home sales (10 a.m.), Leading Economic Indicators Index (10 a.m.), EIA Natural Gas Report (10:30 a.m.).
Today’s earnings include: Gap (GAP), Intuit (INTU), Warner Music Group (WMG), Walmart (WMT).
Click here to log on to your account or learn more about E*TRADE's trading platforms, or follow the Company on Twitter, @ETRADE, for useful trading and investing insights.