Diagnosing a record-setting rally
- LLY rallied to new record highs this week
- Stock up 27% since late-October earnings release
- Current 14-week rally is its largest on record
The driving force behind the health care sector’s recent resurgence isn’t difficult to find. Health care has been the strongest S&P 500 sector over the past week, one month, and three months—and at each interval, pharmaceuticals has been its strongest industry.
And one of the individual pharma stocks that has been a major contributor to this push has been logging new milestones. On Thursday, Eli Lilly (LLY) registered its fourth-straight all-time high—its first push into record territory in more than a year. At its intraday high of $1,032.95, the stock had rallied 27% since October 29, the day before its latest earnings release:
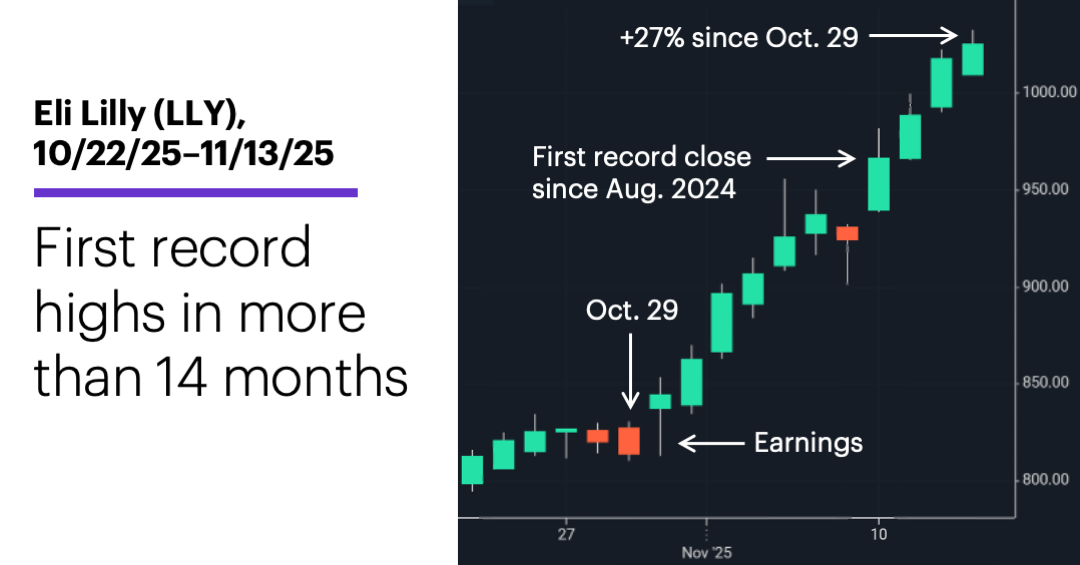
Source: Power E*TRADE. (For illustrative purposes. Not a recommendation.)
In the wake of those numbers, Morgan Stanley & Co. analysts reiterated their Overweight rating on LLY, noting the results (which included strong performance in the obesity drug space) strengthened their outlook.1
Given the magnitude of the stock’s rally since then, traders and investors can likely be divided into two groups—those who see the recent push to new highs as a sign of LLY’s strength, and those who see it as a sign of an overstretched rally.
Of course, depending on one’s time horizon, both viewpoints could be correct. But digging into LLY’s history provides some potentially useful insights into its recent performance. And by almost any historical benchmark, this performance has been “unusual.” A weekly chart shows the stock’s rally over the past 11 days is just part of a 65% surge since August 8—its biggest 14-week rally of the past 40 years:
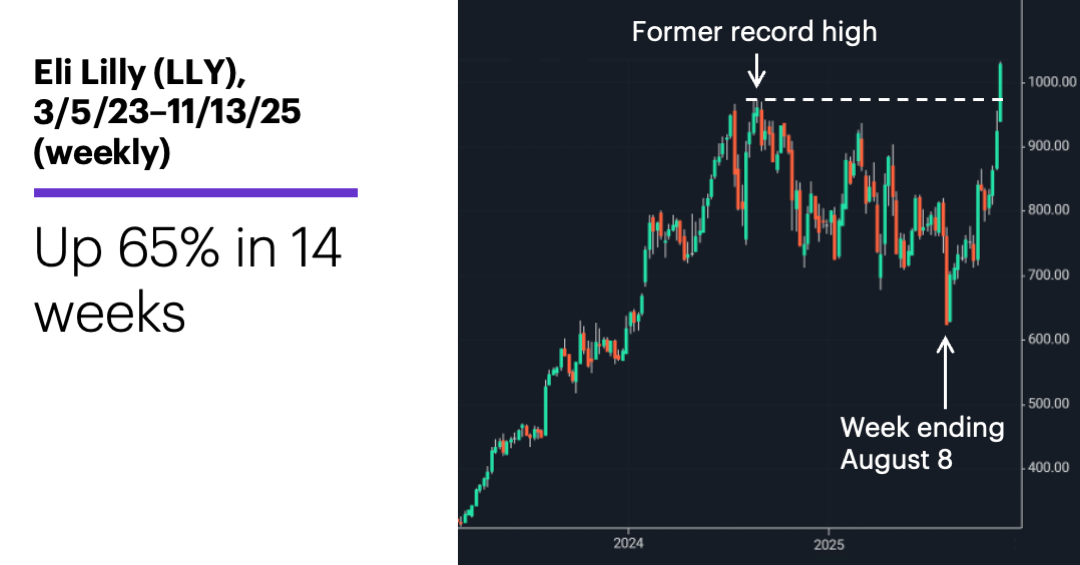
Source: Power E*TRADE. (For illustrative purposes. Not a recommendation.)
To get an idea of how rare this move is, LLY has never rallied as much as 50% in a 14-week span (following a down week), and it’s rallied 40% or more only nine times.2
Such small sample sizes make it difficult to draw conclusions about what happens after moves like this, but the evidence that does exist suggests there’s a good chance that LLY’s volatility could increase in the near future. For example, if we look at the 35 other times the stock rallied 30% or more in a 14-week period, we find that even though the stock closed higher the following week 18 times and lower 17 times, the average one-week return was -0.8%.
Why this counterintuitive result? Because when the stock declined the week after the 14-week rallies, it tended to fall more (-3.17%, on average) than it rallied during the positive weeks (+2%, on average). Another indication that bullish momentum tended to slow after this type of rally: Four weeks later, LLY was lower 20 of 35 times.
That type of information doesn’t negate a longer-term bullish outlook, but it may be food for thought for traders and investors understandably hesitant to chase a fast-rising stock.
Today’s numbers include (all times ET): EIA Natural Gas Report (10:30 p.m.).
Today’s earnings include: Scholar Rock (SRRK)
Click here to log on to your account or learn more about E*TRADE's trading platforms, or follow the Company on Twitter, @ETRADE, for useful trading and investing insights.
1 MorganStanley.com. Another solid quarter. 10/30/25.
2 All figures reflect Eli Lilly (LLY) weekly closing prices, 1985-2025. Supporting document available upon request.