Great (earnings) expectations
- NVDA down as much as 6.6% since earnings
- Sell-off in line with two-year pattern
- Stock up more than 110% since Aug. 2024
NVIDIA’s (NVDA) earnings may seem to be yesterday’s—or, more accurately, last week’s—news, but its post-announcement performance highlights an interesting pattern that has emerged in recent years.
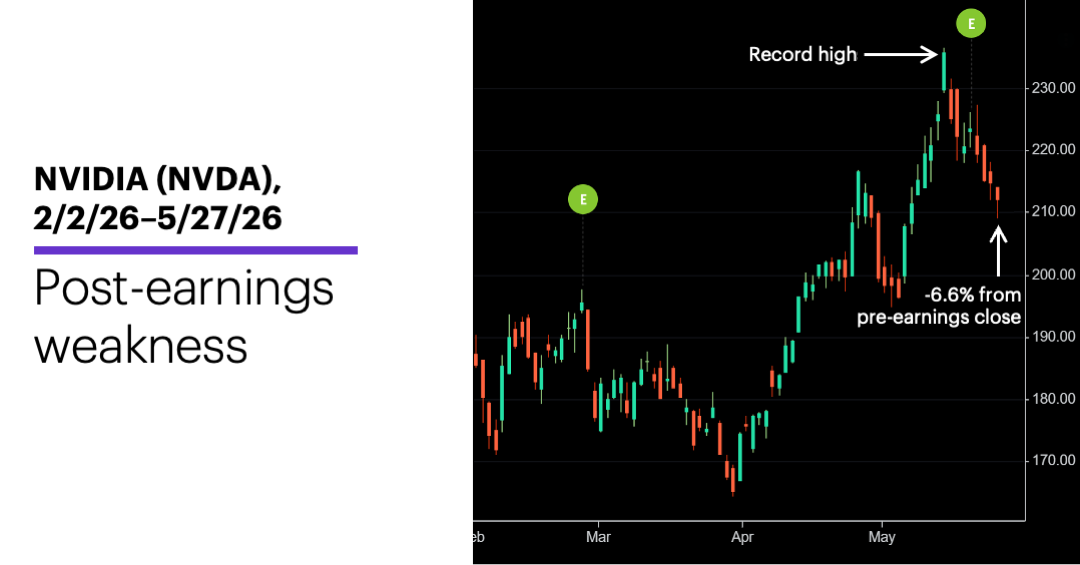
As of Wednesday, the stock had fallen as much as 6.6% below its May 20 pre-earnings close:
Source: Power E*TRADE. (For illustrative purposes. Not a recommendation.)
The move may appear to be out of sync with the news, given NVDA topped its earnings and revenue estimates—and issued optimistic forward guidance. But the chart shows the stock took a similar downward path in the wake of its previous (late-February) earnings announcement, despite outperforming estimates by similar margins.
Of course, just as that sell-off overlapped with the broad market’s decline after the US-Israeli military campaigns against Iran, the start of NVDA’s downturn from its May 14 record high coincided with another market-wide pullback. As of Wednesday, though, the S&P 500 (SPX) had climbed 0.3% since May 14 while NVDA had fallen 10%.
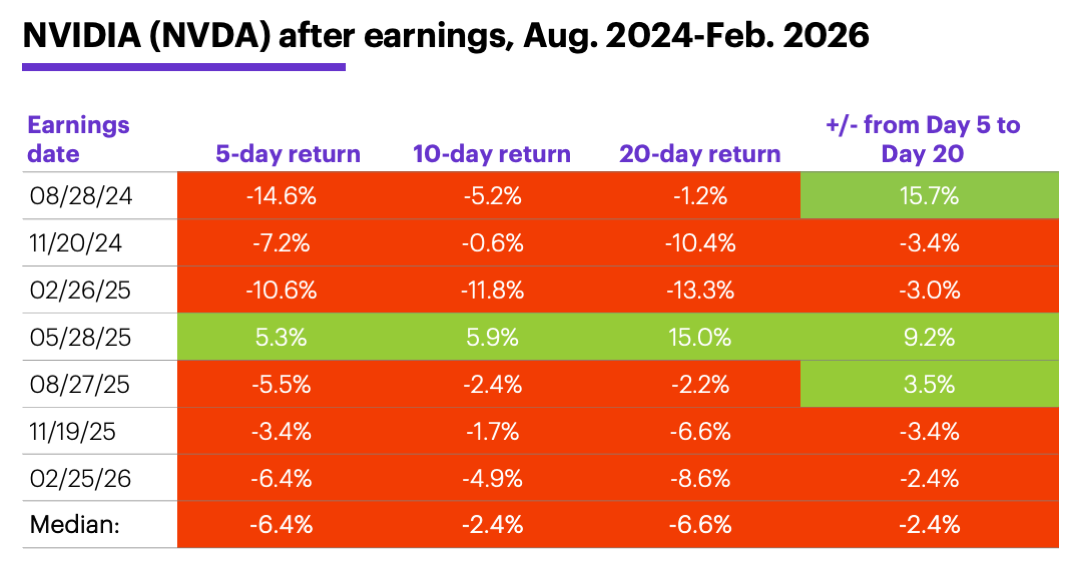
However, the following table shows that post-earnings declines have been the rule rather than the exception for NVDA over the past two years:
Source (data): Power E*TRADE. (For illustrative purposes. Not a recommendation.)
Barring a significant rally today, this will mark the seventh time in the past eight quarters that NVDA has been in the red five trading days after releasing earnings. The six other times the stock was in this position, it was still below its pre-earnings close after 20 trading days, and in four of these cases, the stock lost additional ground from the fifth day after earnings to the 20th (final column).1
However, aside from representing a small portion of NVDA’s earnings history, these post-earnings moves are quite different from the 53 that preceded them. Prior to the most recent two years, NVDA was higher 20 days after earnings 60% of the time, with a median return of 2.9%. And aside from a four-quarter stretch in 2012, it was never lower 20 days after earnings in more than two consecutive quarters.
The stock’s recent post-earnings softness may be partially a matter of elevated expectations. NVDA rallied roughly 918% from September 2022 to June 2024 as the company became the focal point of the AI story, and investors increasingly expected the chip leader not just to beat earnings, but to trounce them—and not find any reason to question its perceived dominance in the chip space, such as recent concerns about challenges to the company’s market share.
According to Morgan Stanley & Co. analysts, who modestly raised their profit target in the wake of last week’s earnings, these concerns—which they describe as difficult to measure and “not particularly meaningful”—could be peaking, and that with a valuation at about half of its AI peers, NVDA “stands out.”2
While this doesn’t mean NVDA will immediately buck the post-earnings pattern it has established over the past couple of years, the longer-term story is always different from the short-term one. Despite its weakness after earnings, the stock is still up more than 110% from its August 2024 low close of $98.91.
Market Mover Update: Despite pulling back more than 3% on Wednesday, GE Vernova (GEV) was still up 2% since testing support after a 15% correction ( see “Energy surges and sentiment slides”).
Gold came a little closer to testing its own support level with its 1%-plus loss on Wednesday (see “Gold tests its mettle”).
Today’s numbers include: Durable Goods Orders (8:30 a.m.), GDP (8:30 a.m.), Weekly Jobless Claims (8:30 a.m.), Personal Income and Outlays (8:30 a.m.), advance Retail and Wholesale Inventories (8:30 a.m.), New Home Sales (10 a.m.), EIA Natural Gas Report (10:30 a.m.).
Today’s earnings include: Autodesk (ADSK), American Eagle Outfitters (AEO), Ambarella (AMBA), Best Buy (BBY), Dell Technologies (DELL), Dollar Tree (DLTR), Gap (GAP), Hormel Foods (HRL), Kohl’s (KSS), Okta (OKTA).
Click here to log on to your account or learn more about E*TRADE's trading platforms, or follow the Company on Twitter, @ETRADE, for useful trading and investing insights.
1 All figures represent NVIDIA (NVDA daily closing prices, 2010-2026. Supporting document available upon request.
2 MorganStanley.com. NVIDIA earnings straight down the fairway. 5/21/26.