Market swings into summer
- Up week for stocks, defensive sectors lead
- Yields pull back after hitting fresh highs, oil dips
- This week: Fed inflation, retail and tech earnings
Rising oil prices have been one of the market’s main trip wires in recent months, but last week stocks appeared to focus on a different type of increase.
Although the S&P 500 (SPX) stumbled early last Monday as US spot oil prices approached $109, a continued surge in Treasury yields overshadowed the energy story. On Tuesday, the 10-year yield closed at a 14-month high of 4.66%, while the 30-year yield hit a 19-year high of 5.18%. But as yields (and oil prices) eased, the SPX rebounded to hit a new weekly high close—just a little below its May 14 record daily close—despite losing some momentum intraday on Friday:
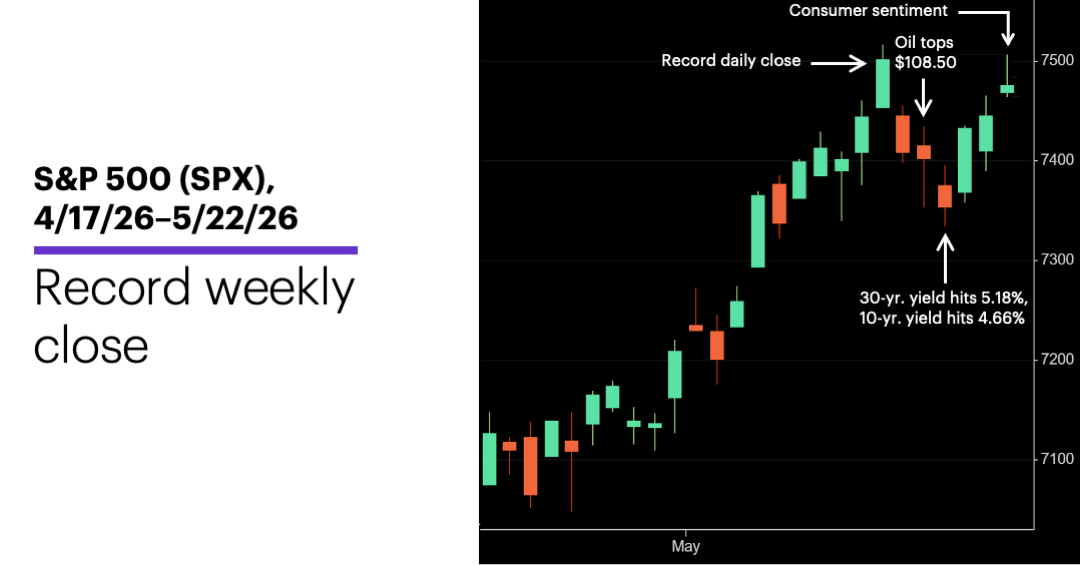
Source: Power E*TRADE. (For illustrative purposes. Not a recommendation. Note: It is not possible to invest in an index.)
The headline: Rally continues to absorb punches.
The fine print: Sustained higher interest rates—specifically, the 4.5% level on the 10-year Treasury yield—could prove to be a headwind for US stocks. If bond market volatility increases as longer-duration yields climb, Morgan Stanley & Co. strategists see the potential for the stock market to experience its first “meaningful correction” since the March lows.1
The number: 44.8, the Consumer Sentiment reading released on Friday—the lowest in more than decade.
The move: -3.6%, NVIDIA’s (NVDA) Thursday-Friday decline after its estimate-topping earnings release.
The scorecard: The Russell 2000 (RUT) climbed the most last week, but it still trails the Nasdaq 100 (NDX) tech index for the year:
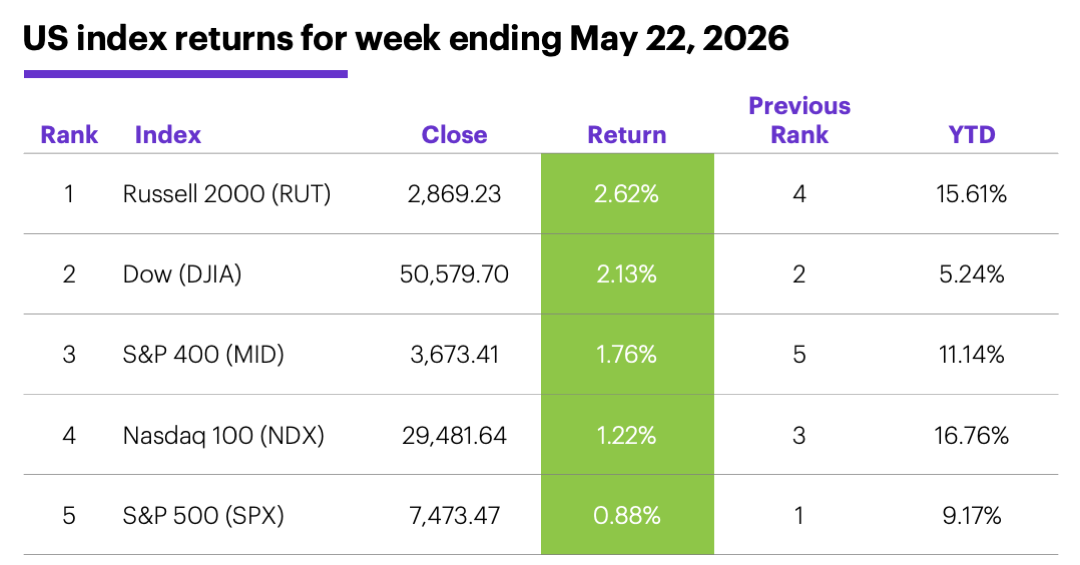
Source (data): Power E*TRADE. (For illustrative purposes. Not a recommendation.)
Sector returns: The strongest S&P 500 sectors last week were health care (+3.31%), utilities (+3.30%), and real estate (+3%). The weakest sectors were communication services (-1.9%), consumer staples (-1%), and energy (-0.4%).
S&P 500 stock movers: The biggest gains last week were Dell (DELL) +22% to $295.19, HP (HPQ) +21% to $25.24, Skyworks Solutions (SWKS) +20% to $82.42. The biggest losses were Intuit (INTU) -19% to $319.94, Vertiv (VRT) -12% to $327.46, EchoStar (SATS) -10% to $124.2. Other movers: Immunovant (IMVT) +35% to $35.56 on Wednesday, Design Therapeutics (DSGN) -26% to $10.70 on Monday.
Yields and the dollar: The 10-year US Treasury yield slipped 0.03% to 4.56% last week. The US Dollar Index (DXY) ended a sideways week 0.04 at 99.24.
Commodity futures: July WTI crude oil (CLN6) fell $4.42 to $96.60 for the week. June gold (GCM6) fell $38.70 to $4,523.20. Biggest gains: June ethanol (ZKM6) +5.7%, July orange juice (OJN6) +4.3%. Biggest declines: July Lithium (LTHN6) -6.7%, July butter (CBN6) -6.2%.
Crypto: Bitcoin fell 4.5% to $75,488.24 last week, while Ethereum dropped 7.1% to $2,064.64.
Coming this week
This week’s numbers include the Fed’s preferred interest rate gauge (PCE Price Index), durable goods, consumer confidence, housing data, and the final estimate of Q1 GDP:
●Tuesday: Chicago Fed National Activity Index, S&P Case-Shiller Home Price Index, FHFA House Price Index, Consumer Confidence
●Thursday: PCE Price Index, Durable Goods Orders, Q1 GDP (final), Personal Income and Spending, New Home Sales
●Friday: Goods Trade Balance (advance), Wholesale and Retail Inventories (advance), Chicago PMI
More retail earnings share the calendar with several high-profile tech names. Some highlights:
●Tuesday: Macy's (M), Ooma (OOMA), Semtech (SMTC), Zscaler (ZS)
●Wednesday: Agilent Technologies (A), Abercrombie & Fitch (ANF), Burlington Stores (BURL), Salesforce (CRM), Dick’s Sporting Goods (DKS), HP (HPQ), Marvell Technology (MRVL), Snowflake (SNOW), U-Haul (UHAL)
●Thursday: Autodesk (ADSK), American Eagle Outfitters (AEO), Ambarella (AMBA), Best Buy (BBY), Dell Technologies (DELL), Dollar Tree (DLTR), Gap (GAP), Hormel Foods (HRL), Kohl’s (KSS), Okta (OKTA)
●Friday: Buckle (BK)
S&P 500 rebound hits two-month mark
Last week marked the SPX’s first eight-week win streak (following a down week) since December 2023—a milestone the index has matched or exceeded only 18 other times since 1957. The index closed higher the next week in half of the cases, but after two weeks it was lower 12 times with a median return of -0.76%:
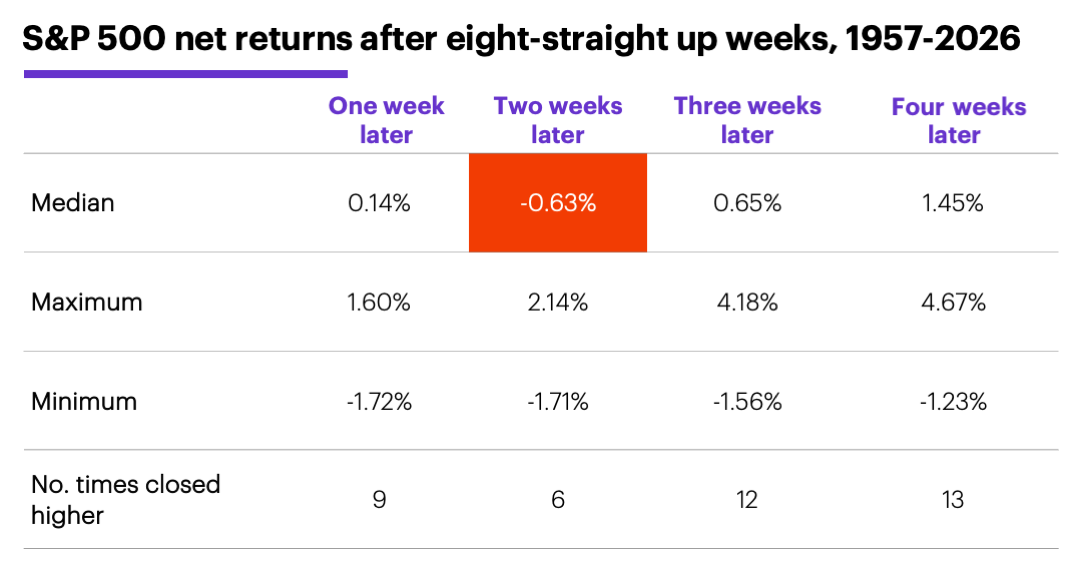
Source (data): Power E*TRADE Pro. (For illustrative purposes. Not a recommendation. Note: It is not possible to invest directly in an index.)
However, after four weeks, the SPX was higher in 13 of the 18 cases (72% of the time) with a median return of 1.45%—a little better than the 1.1% median return for all four-week periods over the past 70 years.2
Interestingly, the negative median net return after two weeks aligns with the SPX’s tendency to close lower three weeks after back-to-back weeks of higher SPX and Cboe Volatility Index (VIX) closes, which happened on May 15.
Click here to log on to your account or learn more about E*TRADE's trading platforms, or follow the Company on X (Twitter), @ETRADE, for useful trading and investing insights.
1 MorganStanley.com. Weekly Warm-Up: Thoughts from the Road. 5/18/26.
2 All figures reflect S&P 500 (SPX) weekly closing prices, 1957-2026. Supporting document available upon request.