Tech turn cools market
- Market pulls back as AI leaders take a breather
- Mixed messages from private-market labor data
- This week: Shutdown debate, DIS, CRWV, CSCO earnings
After driving the market to record highs in September and October—the market’s historically weakest and most-volatile months, respectively—the tech sector got the traditionally bullish month of November off to a somewhat bearish start.
Slowing momentum in some of the market’s AI leaders at the very end of October morphed into a pullback last week, with the S&P 500 (SPX) slipping to its lowest level in three weeks early Friday before a rebound erased a 1.3% intraday deficit and trimmed the week’s losses:
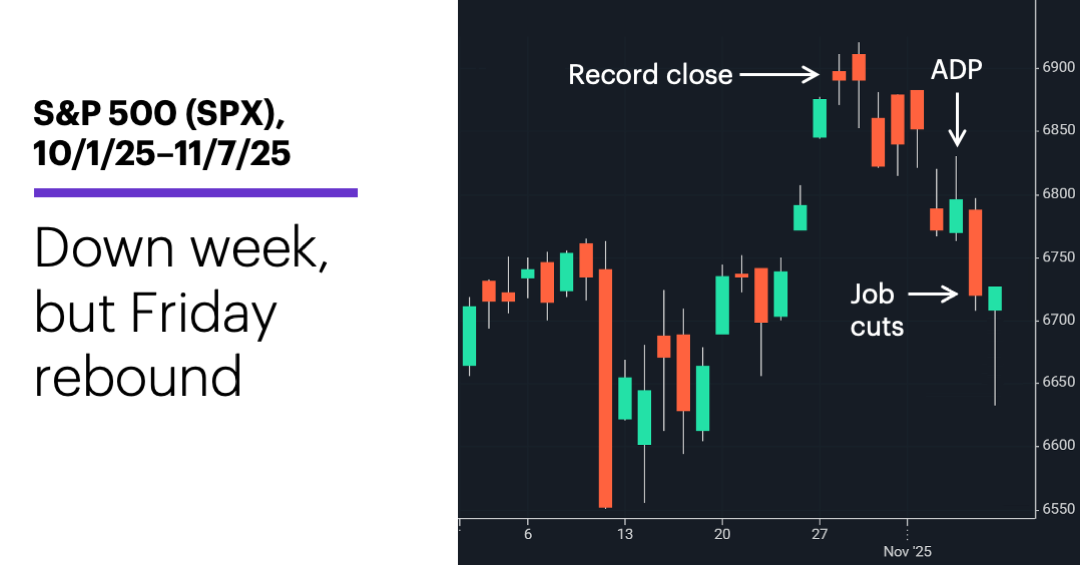
Source: Power E*TRADE. (For illustrative purposes. Not a recommendation. Note: It is not possible to invest in an index.)
The headline: AI valuations cue retreat.
The fine print: All the Mag-7/AI hyperscalers that reported earnings in late October—Alphabet (GOOGL), Amazon (AMZN), Apple (AAPL), Meta (META), and Microsoft (MSFT)—fell last week, although GOOGL’s decline was modest. But Palantir’s (PLTR) post-earnings sell-off last Tuesday (despite a strong earnings beat and bullish forward guidance) appeared to set the tone for an AI “risk-off” week.
The number: 153,074, the number of October job cuts reported last week—the highest since 2003, and widely cited as a factor in Thursday’s market drop. However, the ADP private jobs total surprised to the upside a day earlier. Although both numbers received more attention than usual in the absence of the government’s monthly jobs report, neither has a track record of reliably forecasting labor trends.
The scorecard: Not surprisingly, the Nasdaq 100 (NDX) tech index lost the most ground last week:
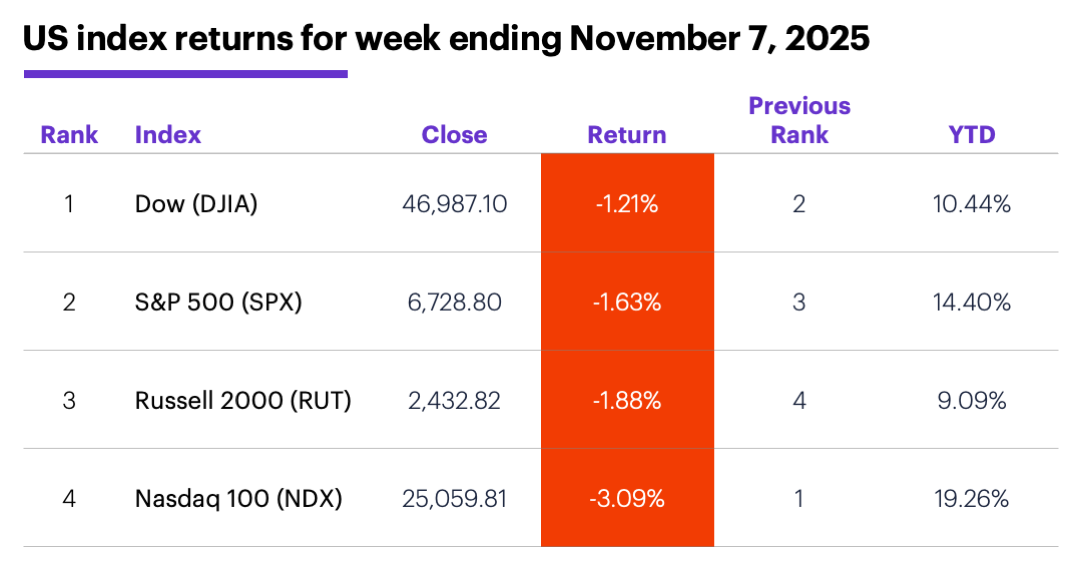
Source (data): Power E*TRADE. (For illustrative purposes. Not a recommendation.)
Sector returns: The strongest S&P 500 sectors last week were energy (+1.5%), health care (+1.3%), and real estate (+1%). The weakest sectors were information technology (-4.3%), communication services (-1.7%), and consumer discretionary (-1.5%).
Stock moves: Tactile Systems (TCMD) +41% to $22.18 on Tuesday, Forge Global (FRGE) +69% to $44.07 on Thursday. On the downside, uniQure (QURE) -49% to $34.29 on Monday, American Superconductor (AMSC) -38% to $36.55 on Thursday.
Yields and the dollar: The 10-year US Treasury yield was unchanged at 4.09% last week. The US Dollar Index (DXY) dropped 0.20 to 99.60.
Futures: Gold prices consolidated last week, with December futures (GCZ5) climbing $13.30 to $4,009.80. December WTI crude oil (CLZ5) fell $1.23 to $59.75 last week. Biggest rallies: December natural gas (NGZ5) +4.8%, March coffee (KCH5) +4%. Biggest declines: November ether (METX5) -11.1%, November bitcoin (MBTX5) -6%.
This week's highlights
This week’s earnings include:
●Monday: CoreWeave (CRWV), Groupon (GRPN), Disc Medicine (IRON), Monday.com (MNDY), Tyson Foods (TSN), Mineralys Therapeutics (MLYS).
●Tuesday: AstraZeneca (AZN), Cisco Systems (CSCO), Dillard's (DDS), Oklo (OKLO)
●Wednesday: Applied Materials (AMAT), Inhibrx Biosciences (INBX)
●Thursday: Alibaba (BABA), Canadian Solar (CSIQ), Walt Disney (DIS), JD.com (JD), Tower Semiconductor (TSEM)
●Friday: Scholar Rock (SRRK)
The government shutdown may end as soon as today, but this week's economic calendar will remain sparse:
●Tuesday: NFIB Business Optimism Index, ADP Employment Change (weekly)
●Wednesday: EIA Petroleum Status Report
Check the Active Trader Commentary each morning for an updated list of earnings announcements, IPOs, economic reports, and other market events.
Pullback comparison
As of Friday, the SPX’s retreat from its October 28 record close was in its eighth day—rather remarkably, its longest-lasting descent since April. Nonetheless, the index ended last week only 2.4% below its all-time high.
If we wanted to find out how the index has performed in similar situations, we’d need to model the current downturn. While there’s some subjectivity involved in this process, some of the key characteristics (as of Friday) might be:
1. The index made a significant high eight trading days earlier.
2. The index is down at least 2% from that high.
3. The index fell to its lowest (intraday) level in at least two weeks.
If we define a “significant high” as the highest close in at least 90 trading days (roughly three months), we find the SPX has made 72 other similar moves since May 1957 (the most recent was on March 3 of this year). A week later, the index was higher in 45 instances (62.5% of the time), with a median gain of 0.7%. However, after two weeks it was higher in 41 instances, with a median gain of 0.4%.1
Of course, the fact that the market tended to rebound the next week more often than it declined doesn’t guarantee that it will do so this time. Nonetheless, knowing what the market “typically” does in a given situation can give you an idea of when it’s possibly behaving out of character—and those situations bear watching.
Click here to log on to your account or learn more about E*TRADE's trading platforms, or follow the Company on X (Twitter), @ETRADE, for useful trading and investing insights.
1 Reflects S&P 500 (SPX) closing prices, 1957-2025. The specific pattern refers to an SPX 90-day-or-higher close, followed by a lower close, followed by (seven trading days later) the SPX closing at least 2% below the high close while also hitting its lowest price in at least 10 trading days. Supporting document available upon request.