Pharma stock tests support
- LLY up more than 6% in past week since testing support level
- Stock fell 20% in three weeks after May earnings release
- Four rallies have occurred from similar levels since April 2024
A weekly chart of Eli Lilly (LLY) shows the pharma giant’s stock has been in a broad trading range for the past year or so, bounded by its all-time highs above $950 on the upside and its early-April lows around $725 on the downside:
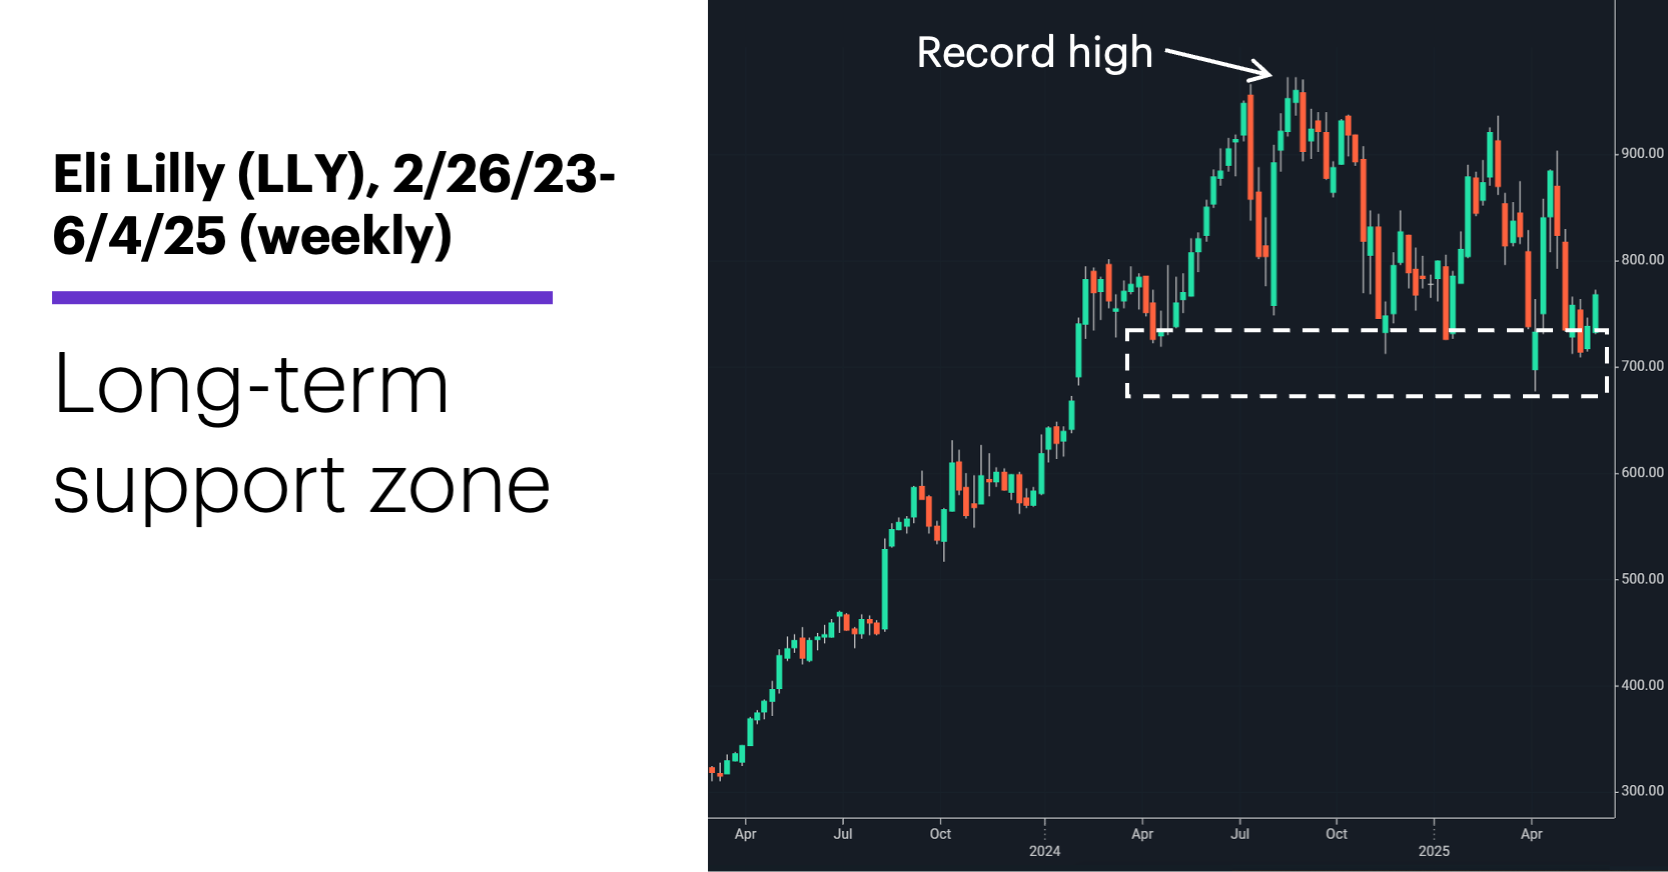
Source: Power E*TRADE. (For illustrative purposes. Not a recommendation.)
The chart is a reminder that support and resistance “levels” are more appropriately thought of as approximate zones. In this case, all but one of LLY’s important swing lows since April 2024 have fallen between roughly $675-$725.
Most recently, the stock retreated into this support zone after falling 20% in the three weeks following its May 1 earnings release. But as of Wednesday, LLY had bounced 6.5% in a week, closing at its highest level since May 7.
A daily chart of LLY’s closing prices removes much of the “noise” from the weekly chart, reinforcing the idea that the stock bounced after testing long-term support. It also shows how much the stock gained after the past four times it reached this level:
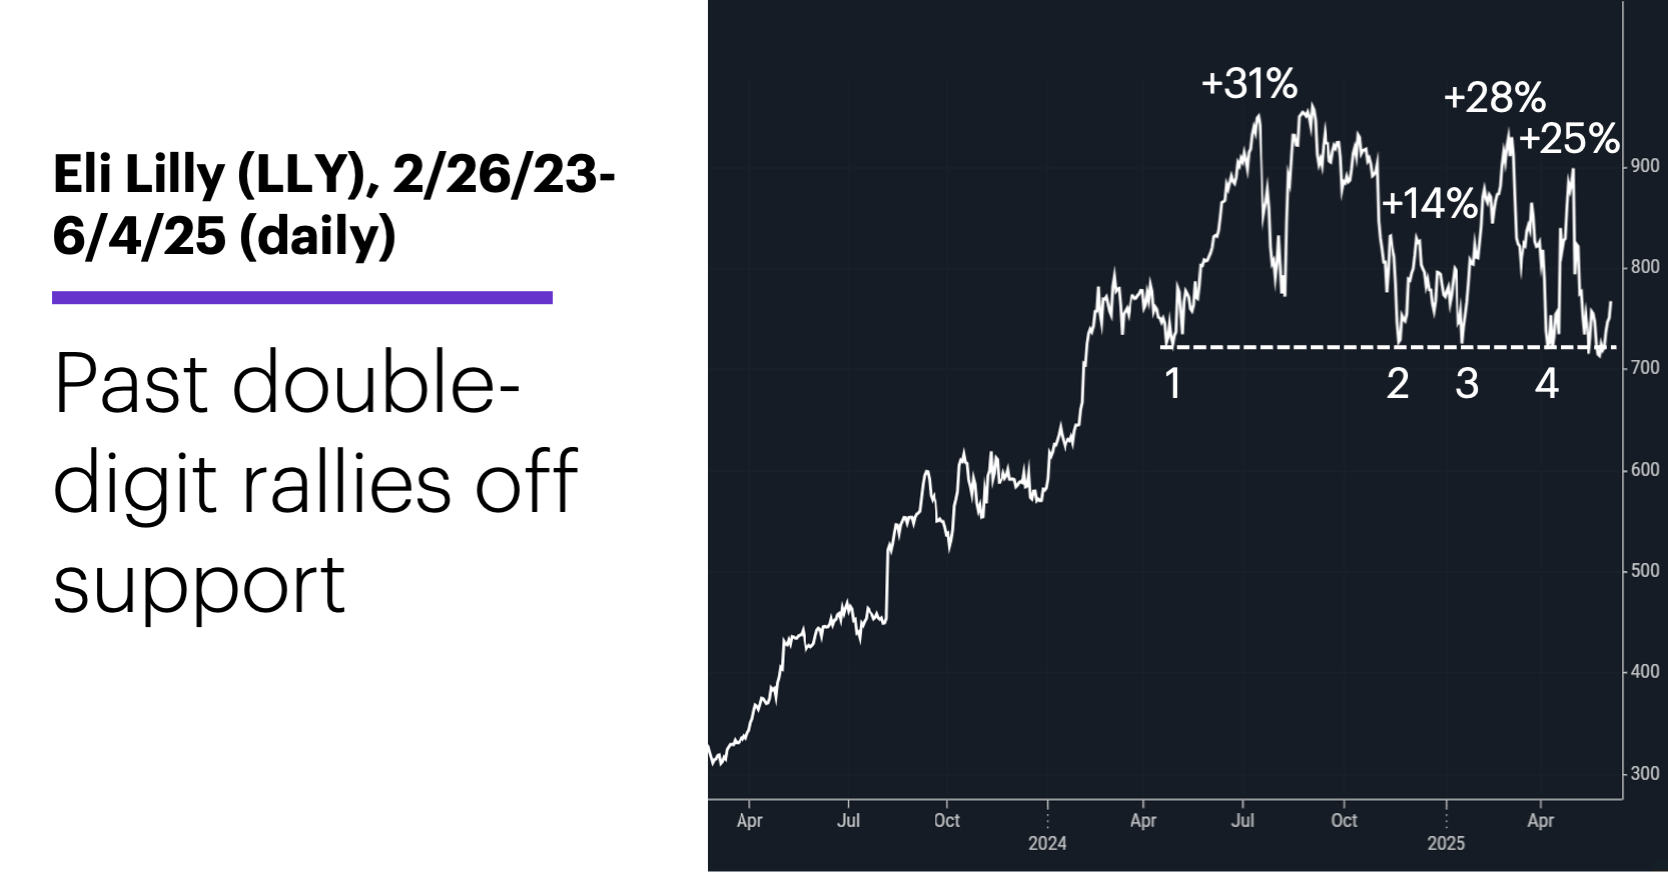
Source: Power E*TRADE. (For illustrative purposes. Not a recommendation.)
The smallest rebound, which occurred in November-December 2024, was twice the size (14%) of the current bounce.
There’s nothing magical or mysterious about this type of price action. Support and resistance simply represent approximate levels at which buyers or sellers have entered the market in the past. In this case, for example, it’s undeniable that buyers have repeatedly stepped into the market in the zone around $700. Perhaps they did so because fundamental models or other analysis tools suggested a favorable risk-reward balance around this level.
Whether they continue to bid up the stock this time remains to be seen. New information may change assessments of risk and reward. Experienced traders tend to take a pragmatic view of such levels. For example, the test of a well-defined support level may be used as a trigger to buy, but when that level is broken convincingly to the downside, opportunistic traders may switch to the short side of the market.
Note: Morgan Stanley & Co. has an overweight rating on LLY, with a 12-month price target of $1,133.
Today’s numbers include (all times ET): job cuts (7 a.m.), weekly jobless claims (8:30 a.m.), trade balance (8:30 a.m.), productivity and labor costs (8:30 a.m.), EIA natural gas report (10:30 a.m.).
Today’s earnings include: Broadcom (AVGO), Braze (BRZE), Cracker Barrel (CBRL), Ciena (CIEN), DocuSign (DOCU), Lululemon (LULU).
Click here to log on to your account or learn more about E*TRADE's trading platforms, or follow the Company on Twitter, @ETRADE, for useful trading and investing insights.