Market still navigating tech volatility
- Tech loses ground despite strong NVDA earnings
- Friday rally: rate-cut optimism fuels pivot
- This week: Fed inflation, retail sales, Thanksgiving
The market appeared to have gotten what it wanted from AI flagship stock NVIDIA (NVDA) last week—an earnings beat, optimistic forward guidance, and a solid initial jump from its stock—but it wasn’t enough to stem the November tech pullback.
NVDA’s bearish pivot last Thursday—turning a 5.1% intraday gain into a 3.2% closing loss—was mirrored by an intraday reversal in the broad market that sent the major indexes to their lowest levels since September.
Bulls got a respite on Friday, though. NVDA erased an early loss, and the S&P 500 (SPX) also rebounded to end the day up nearly 1%, buoyed in part by increased optimism about potential Fed rate cuts. However, the index pulled back late in the session, closing in the lower half of the day’s range:
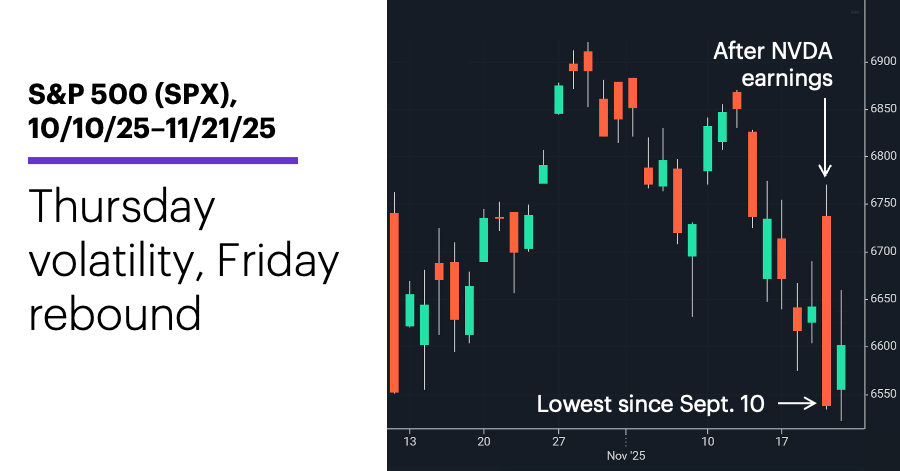
Source: Power E*TRADE. (For illustrative purposes. Not a recommendation. Note: It is not possible to invest in an index.)
The headline: NVDA fails to turn tech tide—for now.
The fine print: While bulls may have been disappointed by last week’s extension of the tech/AI pullback, the magnitude of the preceding rally makes the cooldown a little more understandable. Between April 4 and October 31, the Nasdaq 100 (NDX) gained 48.6%—its biggest 31-week gain since 2020, and its fifth-biggest of the past 25 years. As of Friday, the NDX was still less than 9% below its October 29 record close, while the SPX was less than 5% below its all-time high.
The number: 71.5%, the market-based probability of a 0.25% rate cut on December 10 (as of Friday) —roughly the same odds a day earlier that the Fed would leave rates unchanged.1 But New York Fed president John Williams’ comments early Friday about “further adjustment in the near term” appeared to change impressions about the likelihood of a December cut—and arguably boosted stock-market sentiment in the process.
The scorecard: The Russell 2000 (RUT) small-cap index fell the least last week:
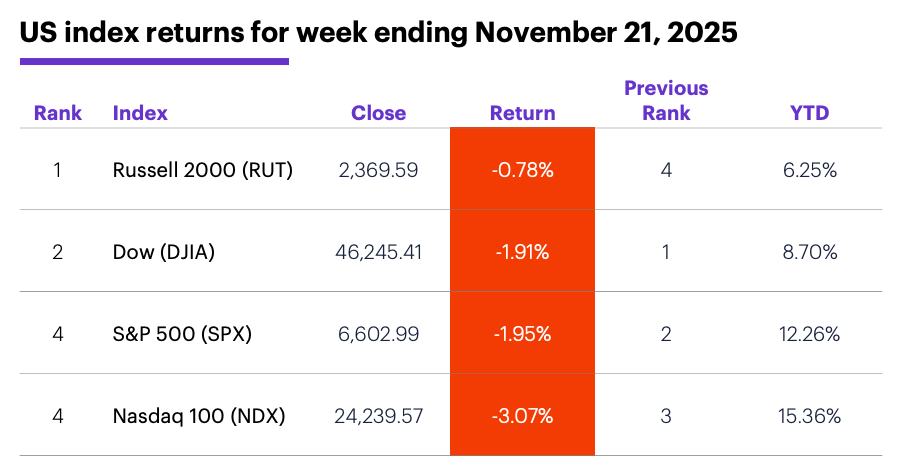
Source (data): Power E*TRADE. (For illustrative purposes. Not a recommendation.)
Sector returns: The strongest S&P 500 sectors last week were communication services (+3.3%), health care (+2.2%), and consumer staples (+1%). The weakest sectors were tech (-4.3%), energy (-3.1%), and consumer discretionary (-3%).
Stock moves: Pacs Group (PACS) +48% to $15.7 on Monday (and +55% to $26.14 on Thursday), Olema Pharmaceuticals (OLMA) +136% to $20.15 on Tuesday. Agios Pharmaceuticals (AGIO) -51% to $22.34 on Wednesday, Bath & Body Works (BBWI) -25% to $15.82 on Thursday.
Yields and the dollar: The 10-year US Treasury yield fell 0.09% to 4.06% last week. The US Dollar Index (DXY) climbed 0.88 to 100.18.
Futures: December gold (GCZ5) was confined to a narrow range last week, slipping $14.70 to $4,079.50. A sharp Thursday-Friday sell-off left January WTI crude oil (CLF6) down $1.89 to $58.06 for the week. Biggest rallies: December VIX (VXZ5) +7.9%, January Lithium (LTHF6) +1.4%. Biggest declines: November ether (ETHX5) -12.8%, November bitcoin (BTCX5) -10.4%.
This week's highlights
The trading week may be short, but the economic report lineup is fairly long, highlighted by retail sales and Fed inflation (PCE Price Index) the day before Thanksgiving:
●Monday: Chicago Fed National Activity Index
●Tuesday: Producer Price Index (PPI), retail sales, S&P Case-Shiller Home Price Index, NAHB House Price Index, consumer confidence, pending home sales
●Wednesday: durable goods orders, retail and wholesale inventories (advance), Chicago PMI, PCE Price Index, personal income and spending, new home sales
●Thursday: Thanksgiving (US markets closed)
●Friday: US stock exchanges close early (1 p.m. ET)
This week’s earnings include:
●Monday: Agilent (A), Guess (GES), Keysight (KEYS), Urban Outfitters (URBN), Zoom Communications (ZM)
●Tuesday: Analog Devices (ADI), Ambarella (AMBA), Abercrombie & Fitch (ANF), Alibaba (BABA), Best Buy (BBY), Burlington Stores (BURL), Dell (DELL), Dick's Sporting Goods (DKS), HP (HPQ), Kohl’s (KSS), J.M. Smucker (SJM), Zscaler (ZS)
●Wednesday: Deere (DE)
Check the Active Trader Commentary each morning for an updated list of earnings announcements, IPOs, economic reports, and other market events.
Thanksgiving seasonal
Last week’s market recap highlighted the challenges the SPX has had turning November positive when (as was the case this year) the index was in negative territory halfway through the month. It also showed that, in these situations, the SPX posted a negative net return for the next five trading days more often than not.
Last week’s loss padded that historical tendency. While the odds of a positive November this year may be low, bulls looking for a rebound may have one seasonal tendency—if it materializes—in their corner: historical bullishness during the shortened Thanksgiving week.
Since 1960, the SPX’s median net gain for Thanksgiving week is 0.82%, which is more than twice as much as the index’s median return for all weeks:
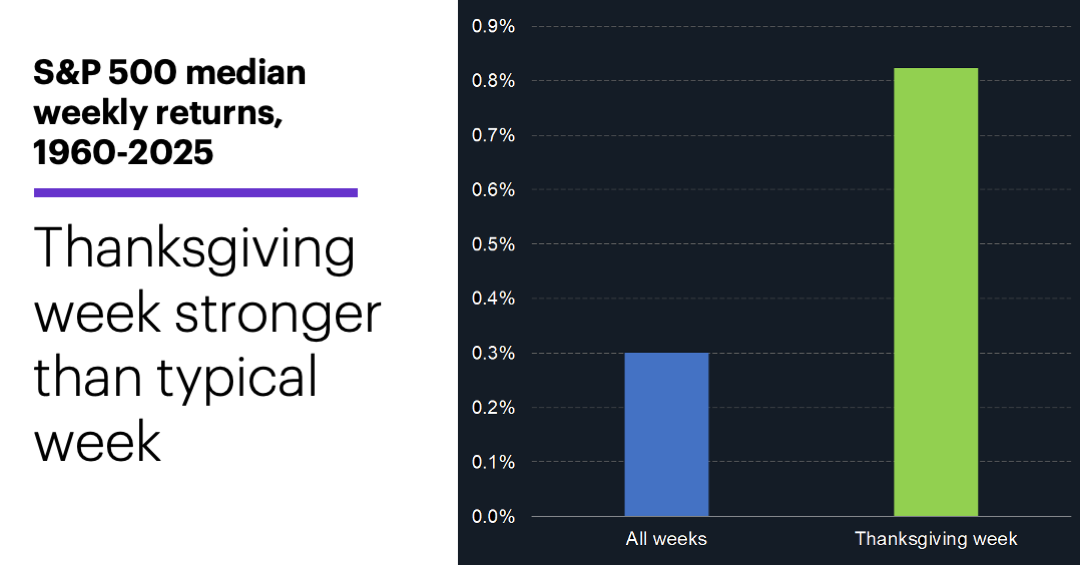
Source: Power E*TRADE. (For illustrative purposes. Not a recommendation. Note: It is not possible to invest directly in an index.)
This outperformance is less about how much the market has tended to rally during Thanksgiving week than it is about how often it has rallied. For example, while the SPX had a positive return in roughly 56% of all weeks since 1960, it was positive in 69% of Thanksgiving weeks (45 of 65). Eight of the past 10 and 14 of the past 20 Thanksgiving weeks have been positive.2
Looking at up weeks and down weeks separately sheds more light on this dynamic. The median SPX positive week since 1960 is +1.21%, which is just a hair larger than the 1.16% median return for positive Thanksgiving weeks. On the flipside, the SPX’s median down week is -1.24%, which is larger than the -0.83% return for negative Thanksgiving weeks.
In other words, when Thanksgiving week has been positive, the SPX’s return has been more or less in line with its typical weekly gain. But Thanksgiving week losses have tended to be smaller than the typical down week.
The key words here are “tended” and “typical.” It’s important to note the SPX posted sizable losses in its three most recent negative Thanksgiving weeks, falling 2.2% in 2021, 3.8% in 2018, and 4.6% in 2011.
Click here to log on to your account or learn more about E*TRADE's trading platforms, or follow the Company on X (Twitter), @ETRADE, for useful trading and investing insights.
1 MorganStanley.com. Qtr should bring focus back to NVIDIA's market leadership. 11/14/25.
2 All figures reflect S&P 500 (SPX) daily and weekly prices, 1960-2024. Supporting document available upon request.