Tech strong enough
- Tech fuels market despite late-week momentum slump
- Fed cuts, but signals caution about next meeting
- This week: shutdown continues, private labor data, manufacturing and services
US stocks wrapped up a bullish October with their third-straight up week, as traders and investors appeared to take a mostly favorable view of the week’s high-profile earnings releases, a Fed rate cut, and what amounted to a one-year truce in the US-China trade standoff.
The S&P 500 (SPX) kicked off the week with a solid rally on reports of amicable discussions leading up to last Thursday’s meeting between President Trump and Chinese President Xi Jinping. The result: a one-year pause on China’s export restrictions on “rare earths,” with a corresponding concession from the US on China’s access to advanced tech.
But the week also included some volatility. The Fed cut rates by 0.25% as expected last Wednesday, but Fed Chair Jerome Powell’s attempts to lower expectations for a December rate cut took some air out of the day’s rally. Bulls had trouble finding their footing the final two days of the week amid mixed post-earnings performance from megacap tech stocks:
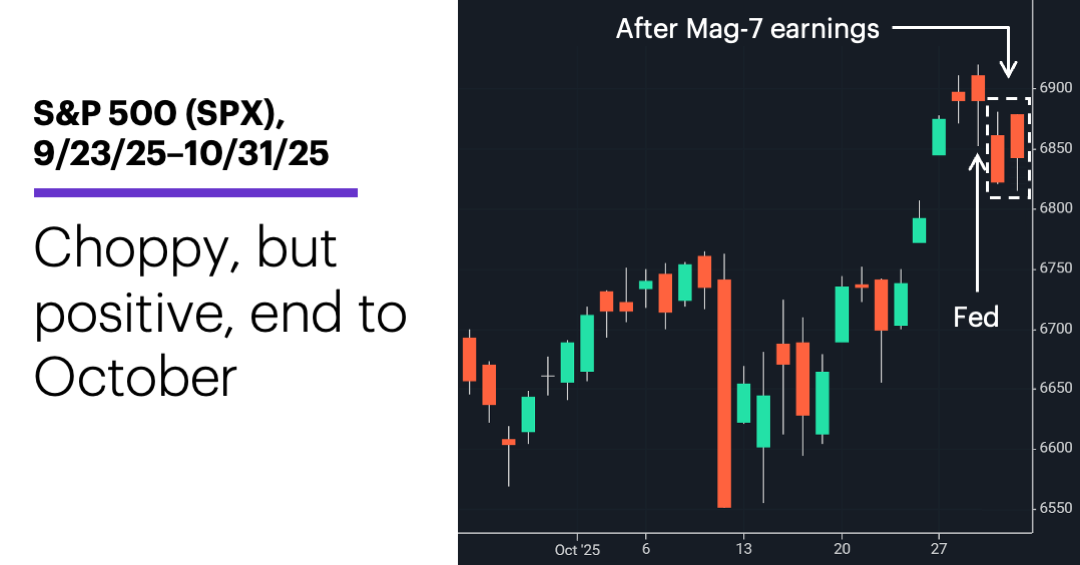
Source: Power E*TRADE. (For illustrative purposes. Not a recommendation. Note: It is not possible to invest in an index.)
The headline: Bullish conclusion to tech-fueled October.
The fine print: Two of the five “Magnificent 7” stocks that reported earnings last week (Alphabet, Amazon) rallied after releasing their numbers, while three (Meta, Microsoft, Apple) declined. Meta (META) was the only one that didn’t top its headline numbers, coming up short on earnings because of a one-time tax charge. The SPX and Nasdaq 100 (NDX) both closed lower on Thursday as META and Microsoft declined, while both indexes closed higher on Friday as Amazon (AMZN) rallied.
The move: Consumer discretionary was the second-strongest S&P 500 sector last week, thanks in large part to Amazon’s (AMZN) 10% post-earnings rally on Friday. Although it’s sometimes thought of exclusively as a tech stock—and is a component of the Nasdaq 100 (NDX) tech index—AMZN is also the largest stock in the S&P 500 consumer discretionary sector.
The scorecard: The NDX outran the rest of the market, while the Russell 2000 (RUT) small-cap index was the only major benchmark to post a loss for the week:
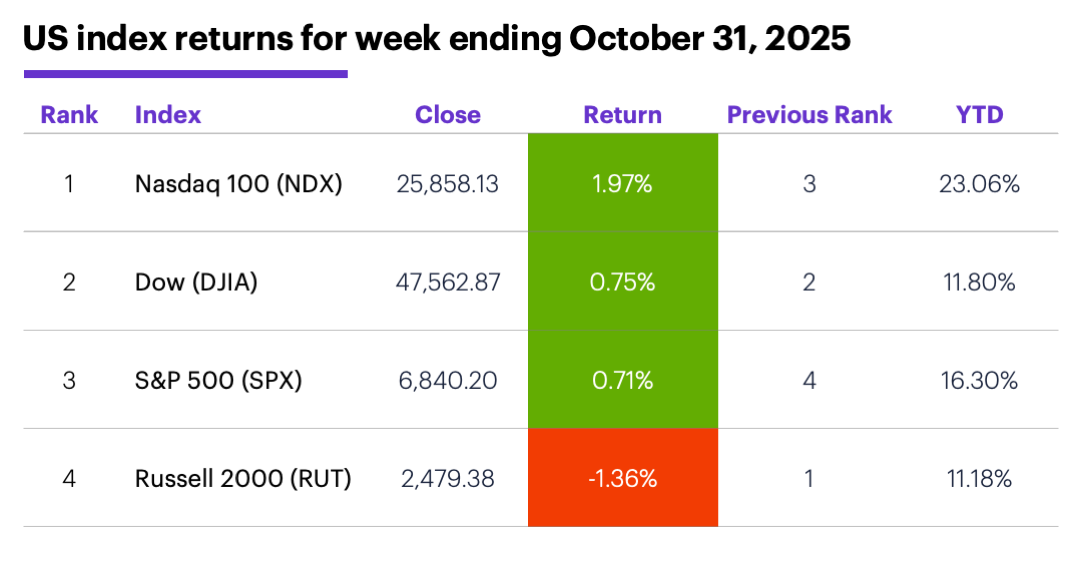
Source (data): Power E*TRADE. (For illustrative purposes. Not a recommendation.)
Sector returns: The strongest S&P 500 sectors last week were tech (+3%), consumer discretionary (+2.8%), and communication services (+0.6%). The weakest sectors were real estate (-3.9%), materials (-3.7%), and consumer staples (-3.7%).
Stock moves: Flowserve (FLS) +31% to $68.95 on Wednesday, Brighthouse Financial (BHF) +25% to $57.07 on Friday. Stride (LRN) -54% to $70.05 and Varonis Systems (VRNS) -49% to $32.34, both on Wednesday.
Yields and the dollar: The 10-year US Treasury yield climbed 0.1% to 4.09% last week. The US Dollar Index (DXY) rallied 0.85 to 99.80.
Futures: It was a second-straight down week for gold, with December futures (GCZ5) falling $141.30 to $3,996.50. December WTI crude oil (CLZ5) slipped $0.52 to $60.98 last week amid reports of potential OPEC production increases. Biggest rallies: December soybean meal (ZMZ5) +9.4%, November Uranium (UXX5) +7%. Biggest declines: January orange juice (OJF6) -8.5%, December oats (ZOZ5) -6.2%.
This week's highlights
The busiest week of earnings season features a heavy slate of tech and consumer names. Semiconductor stocks did much of the heavy lifting for the tech sector last month, and several are reporting this week. Here's a sample:
●Monday: Anheuser-Busch InBev (BUD), Clorox (CLX), Lattice Semiconductor (LSCC), Navitas Semiconductor (NVTS), ON Semiconductor (ON), Palantir Technologies (PLTR), Qorvo (QRVO), Williams Companies (WMB)
●Tuesday: Archer Daniels Midland (ADM), Advanced Micro Devices (AMD), Arista Networks (ANET), Martin Marietta Materials (MLM), Match Group (MTCH), Pfizer (PFE), Shopify (SHOP), Silicon Laboratories (SLAB), Uber (UBER), Yum Brands (YUM)
●Wednesday: Applovin (APP), Arm (ARM), DoorDash (DASH), Duolingo (DUOL), E.L.F Beauty (ELF), Five9 (FIVN), WK Kellogg (KLG), Lemonade (LMND), Lyft (LYFT), McDonald's (MCD), Murphy Oil (MUR), Novo Nordisk (NVO), Qualcomm (QCOM), Royal Gold (RGLD)
●Thursday: Airbnb (ABNB), ConocoPhillips (COP), Dropbox (DBX), Datadog (DDOG), MP Materials (MP), Moderna (MRNA), Ralph Lauren (RL), Rockwell Automation (ROK), NuScale Power (SMR), SanDisk (SNDK), Tapestry (TPR), Ubiquiti (UI), USA Rare Earth (USAR), Block (XYZ),
●Friday: Wendy’s (WEN), Constellation Energy (CEG)
Without the government’s monthly jobs report and weekly jobless claims, private-market data (ADP employment, Challenger job cuts) may get a little more scrutiny than usual:
●Monday: S&P Global Manufacturing PMI, ISM Manufacturing Index, construction spending, vehicle sales
●Tuesday: trade balance, factory orders
●Wednesday: ADP Private Employment, S&P Global Services PMI, ISM Services Index
●Thursday: Challenger job cuts, Productivity and Labor Costs
●Friday: consumer sentiment (preliminary)
Check the Active Trader Commentary each morning for an updated list of earnings announcements, IPOs, economic reports, and other market events.
November market history
November has a track record as one of the strongest months of the year for US stocks. That’s been especially true in recent decades. Since 1991, the S&P 500 (SPX) gained ground in November 25 out of 30 times (74%, second only to April) with a median return of 2.8% (larger than any other month).1

Chart 3: S&P 500 November intramonth profile, 1957-1990 vs. 1991-2024. More consistently bullish since 1991.
The bullishness in recent years is also apparent in how the market has traded throughout November. The chart above shows the SPX’s intramonth return profile for November (the average return from the last day of October to each trading day of November) for two periods—1957-1990 (blue line) and 1991-2024 (green line). It shows the SPX has tended to trade more consistently upward in November since 1990 compared to the previous period.
Whether the SPX;s strong rally off its April lows (+37% as of Friday) will make a bullish November less likely remains to be seen. The market has very few analogs for its current position. Since 1957, the SPX has entered November on a six-month (or longer) winning streak just three other times (2017, 1980, and 1958). November was positive in each case. Casting a slightly wider net, the SPX has had nine other six-month winning streaks with gains of 20% or more. The following month was positive five times and negative four times.
Click here to log on to your account or learn more about E*TRADE's trading platforms, or follow the Company on X (Twitter), @ETRADE, for useful trading and investing insights.
1 Reflects S&P 500 (SPX) closing prices, 1957-2024. Supporting document available upon request