Stocks extend the streak
- Market rallies as oil prices and yields decline
- Tech strength continues to anchor gains
- This week: jobs report, manufacturing and services data
The S&P 500 (SPX) will kick off June riding a nine-week win streak as bulls continued to focus on an AI-driven tech sector in the final week of May.
The market also got a boost from falling oil prices and a pullback in bond yields—both of which had tripped up the market a week earlier—and looked past more signs of rising inflation from the PCE Price Index:
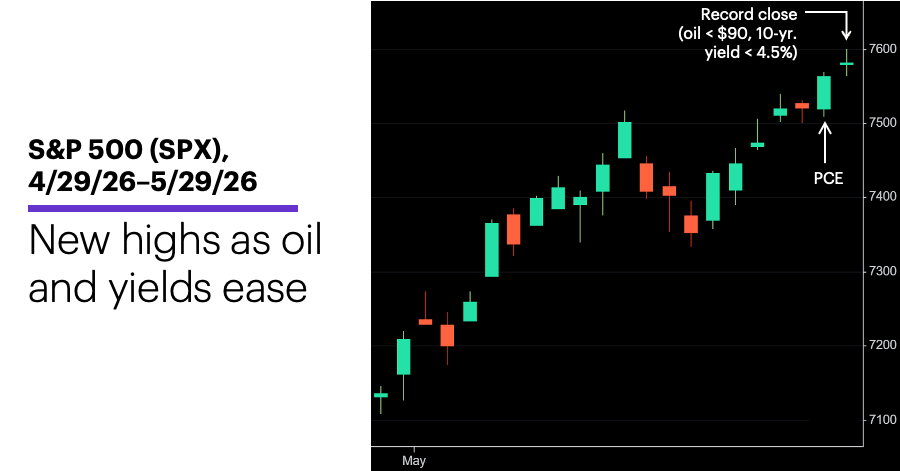
Source: Power E*TRADE. (For illustrative purposes. Not a recommendation. Note: It is not possible to invest in an index.)
The headline: SPX posts biggest two-month gain since April-May 2020.
The fine print: After approaching $109 less than two weeks ago, US crude oil prices closed last week below $90 on continued hopes that the US and Iran would agree to terms to reopen the Strait of Hormuz. Meanwhile, the 10-year Treasury yield ended the week below the 4.5% threshold Morgan Stanley & Co. strategists noted could potentially dampen stock-market momentum.1
The number: 3.8%, the year-over-year headline inflation increase in the PCE Price Index—the highest reading since May 2023.
The scorecard: The Nasdaq 100 (NDX) tech index closed above 30,000 for the first time last Tuesday and pushed its year-to-date gain to nearly 20%:
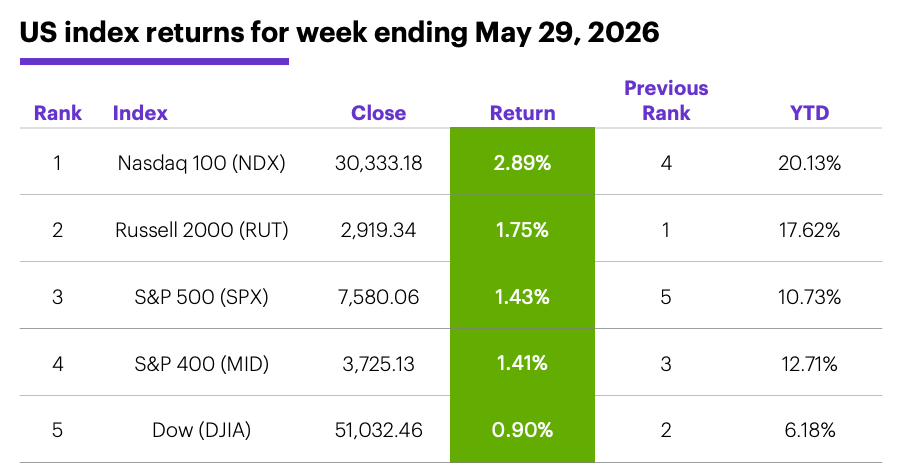
Source (data): Power E*TRADE. (For illustrative purposes. Not a recommendation.)
Sector returns: The strongest S&P 500 sectors last week were tech (+4.6%), consumer discretionary (+1.5%), and materials (+1.2%). The weakest sectors were utilities (-2.1%), consumer staples (-3.2%), and energy (-5.4%).
S&P 500 stock movers: The biggest gains last week were Dell (DELL) +67% to $420.91, Netapp (NTAP) +41% to $174.29. The biggest losses were Boston Scientific (BSX) -15% to $48.31, AutoZone (AZO) -15% to $2,935.19. Other moves: Dycom (DY) +26% to $529.13 on Wednesday, Unusual Machines (UMAC) +57% to $29.60 on Thursday, Zscaler (ZS) -32% to $126.41 on Wednesday, Photronics (PLAB) -36% to $34.02 on Thursday.
Yields and the dollar: The 10-year US Treasury yield dropped 0.11% to 4.45% last week. The US Dollar Index (DXY) fell 0.33 to 98.91.
Commodity futures: July WTI crude oil (CLN6) fell $9 to $87.60 for the week. After tagging two-month intraday low last Thursday, August gold (GCQ6) bounced to end the week up $31.50 at $4,587.90. Biggest gains: July butter (CBN6) +7.5%, July soybean oil (ZLN6) +5.2%. Biggest declines: July WTI crude oil (CLN6) -9%, August Brent crude oil (BQ6) -8.1%.
Crypto: Bitcoin fell 3.1% to $73,149.23 last week, Ethereum dropped 2.9% to $2004.74.
Coming this week
The jobs market is the focal point of a packed economic calendar:
●Monday: S&P Global Manufacturing PMI, ISM Manufacturing Index, Construction Spending
●Tuesday: Job Openings and Labor Turnover Survey (JOLTS)
●Wednesday: ADP Private Employment, S&P Global Services PMI, ISM Services Index, Factory Orders, Fed Beige Book, vehicle sales
●Thursday: Job Cuts, Productivity and Labor Costs
●Friday: Employment Report
This week’s earnings calendar features another mix of retail and tech names. A few highlights:
●Monday: Costco Wholesale (COST), Credo Technology (CRDO), Hewlett Packard Enterprise (HPE), Science Applications (SAIC)
●Tuesday: Dollar General (DG), Gitlab (GTLB), Palo Alto Networks (PANW), Ulta Beauty (ULTA)
●Wednesday: Broadcom (AVGO), CrowdStrike (CRWD), Five Below (FIVE), Macy's (M), Medtronic (MDT), PVH (PVH), Thor Industries (THO)
●Thursday: ABM Industries (ABM), Chewy (CHWY), Ciena (CIEN), Docusign (DOCU), G-III Apparel (GIII), Ollie's Bargain Outlet Holdings (OLLI), Planet Labs (PL), Rubrik (RBRK)
●Friday: Lands’ End (LE)
June stock market tendencies
Since 1957, June has been an up month for the SPX in 38 of 69 years, less frequently than all other months except September and February. Those long-term statistics would be even weaker if not for the past decade, when the SPX gained ground in nine of 10 years—including returns of 6.5%, 3.5%, and 5% in the past three years:
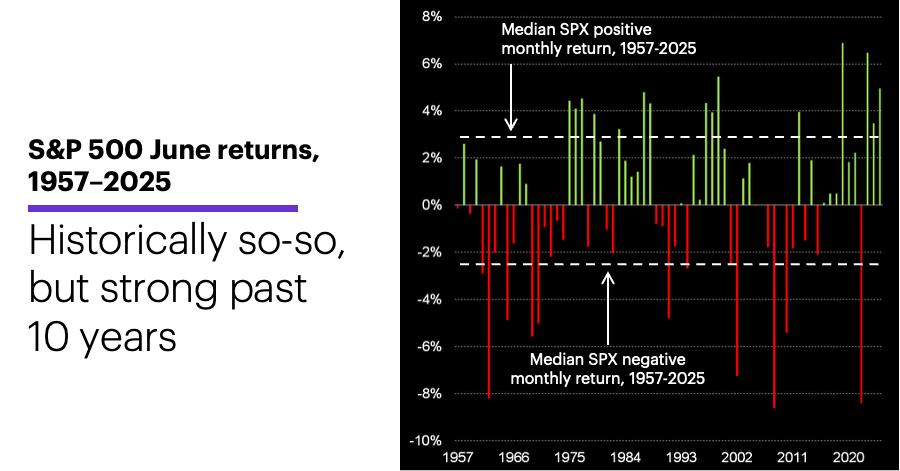
Source (data): Power E*TRADE Pro. (For illustrative purposes. Not a recommendation. Note: It is not possible to invest directly in an index.)
Through 2015, however, June had the third-lowest median return (-0.01%), and was tied with July for the second-most negative returns (30 out of 50) of all months.2
That said, June was more likely to be an up month after strong Mays—like the one that just ended. June was a positive month after 10 of the 11 strongest Mays since 1957, all of which (like the most recent one) had returns of 4.4% or higher. (In contrast, seven of the 11 weakest Mays were followed by negative Junes.)2
Of course, momentum traders will also be considering the likelihood of uninterrupted gains given the SPX is coming off its ninth-straight up week—something its accomplished only 10 other times since 1957. The index closed lower the next week in seven of 10 cases, although it was higher four weeks later in nine of 10 instances.2
Click here to log on to your account or learn more about E*TRADE's trading platforms, or follow the Company on X (Twitter), @ETRADE, for useful trading and investing insights.
1 MorganStanley.com. Weekly Warm-Up: Thoughts from the Road. 5/18/26.
2 All figures reflect S&P 500 (SPX) monthly and weekly closing prices, 1957-2026. “Nine straight up weeks” refers to a lower weekly close followed by nine consecutive higher weekly closes. Supporting document available upon request.