Upside breakout, heavy puts
- Unusual put volume in WMB on Monday
- 30,000 $68 puts traded as stock rallied
- Stock displaying potential support around $70
On Monday, 30,000 Williams Companies (WMB) July 31 $68 puts crossed the tape in early trading. Although that was roughly 17 times WMB’s daily average put volume, it may not have set off many alarms, given it was a soft day for the US stock market overall.
Because the put’s open interest (OI) was zero, it appeared to be a case of a trader establishing a new position:
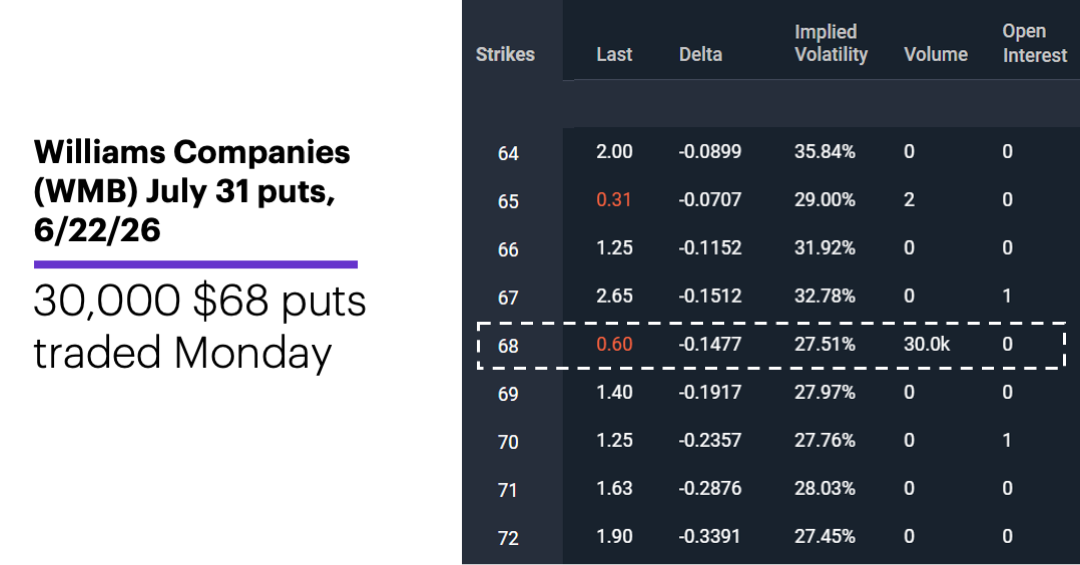
Source: Power E*TRADE. (For illustrative purposes. Not a recommendation.)
Although Monday’s trade was certainly large, a few other WMB options already had OI in excess of 10,000 contracts, including the June 26 $68 puts (11,700), the July $65 puts (22,700), and the November $80 and $95 calls (more than 75,000 each).
What may have struck some market watchers as unusual—since puts are more commonly thought of as tools to take a bearish position on the underlying stock—is that this trade was accompanied by a sharp rally, rather than a sell-off, in WMB shares. The stock rallied 2.5% and hit its highest level ($75.79) in more than three weeks:
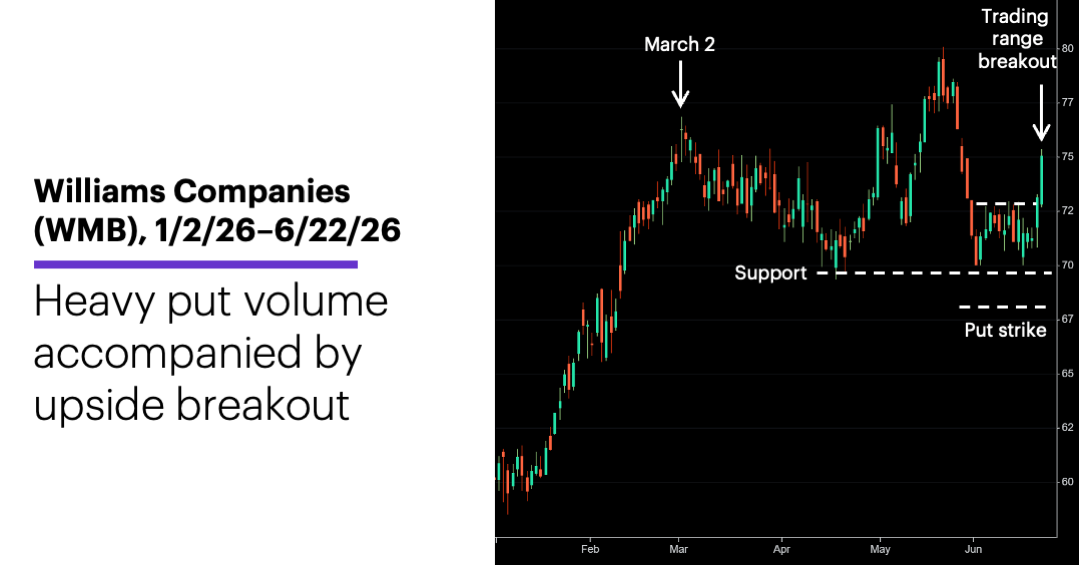
Source: Power E*TRADE. (For illustrative purposes. Not a recommendation.)
Following a roughly 14-month period of essentially sideways price action, from January 15 to March 2, WMB rallied 26.5% to what was then a record high of $76.76. Since then the stock has chopped higher and lower, most recently consolidating for most of June.
The chart shows the bottom of this trading range was more or less aligned with the stock’s April lows around $70, forming a well-defined support level. Remembering that there are two sides to every trade, we can ask why a trader might open a large put position on a day the stock was bucking broad-market weakness and rallying to its highest level in more than three weeks:
1. A trader expecting WMB to fall may have bought the puts because the stock’s rally may have offered more attractive (lower) premiums.
2. A trader expecting the WMB to rally may have shorted the puts, believing the stock's support level was likely to remain intact over the course of the option’s lifetime.
It’s also possible the trade was related to another position, or will become part of a larger (spread) position by virtue of a trade that hasn’t occurred yet. Regardless, both buyer and sellers will likely be closely watching WMB’s support level over the next several weeks.
Market Mover Update: Another stock that recently experienced unusually high put volume, Veeco Instruments (VECO), fell more than 4% intraday on Monday (see “Checking the pattern”).
Today’s earnings include: FedEx (FDX), KB Home (KBH).
Click here to log on to your account or learn more about E*TRADE's trading platforms, or follow the Company on Twitter, @ETRADE, for useful trading and investing insights.