Open interest
- Along with volume, open interest can provide insight into options liquidity
- Open interest can decrease even if there is heavy volume in a particular contract
- Closing positions and exercise affect open interest
Open interest (OI) is the number of unclosed positions in an options contract at the end of a day. Rising OI means more people are establishing positions in a particular option, while declining OI means the opposite, although as we will see shortly, there can be different reasons for OI to decline.
In addition to showing whether traders are opening more positions than they are closing on a net basis, OI also highlights whether they are more active at certain levels (strike prices) than others.
The following options chain shows the open interest in a series of put options with strike prices ranging from $155 to $240:
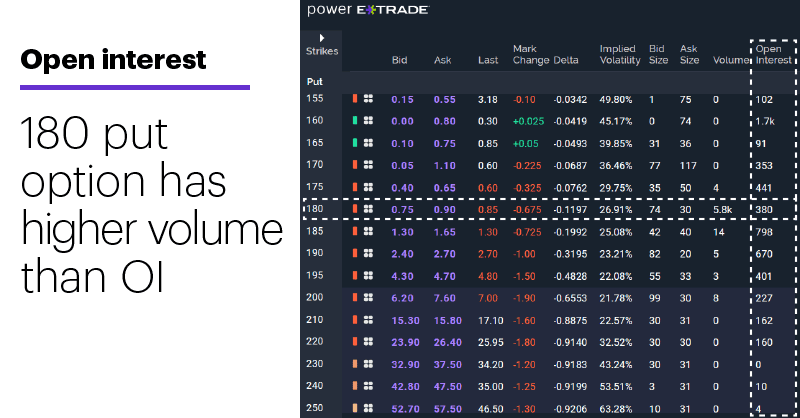
Source: Power E*TRADE
Traders typically consult OI to gauge the level of liquidity in a particular option series and provide some context for volume data. High options volume is often interpreted as a sign of greater participation in a market, as well as a possible indicator of the strength or weakness of a price move in the underlying instrument. For example, traders may look for heavy call buying as confirmation of a stock’s uptrend.
However, high options volume may represent something different if OI is decreasing instead of increasing. That’s because OI can decrease even if volume is high when traders:
1. close existing options positions.
2. exercise their options to create stock positions (less likely if the options are out of the money).
For example, notice in the above example that while the volume in the $180 puts was 5,800 contracts, the OI was only 380 contracts, which could mean a significant portion of the activity consisted of traders closing their existing positions rather than opening new ones, and/or exercising their options. An important caveat is that unlike volume, OI updates only at the end of the trading day, so traders need to compare OI totals from day to the next to know whether it has actually increased or decreased. In this case, if the next day’s OI was 5,800 more than shown here, it’s possible the trades were, in fact, new positions.
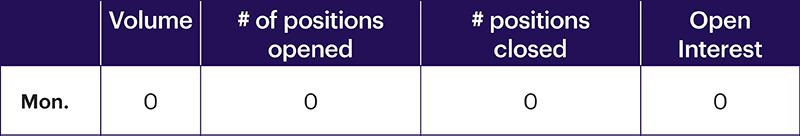
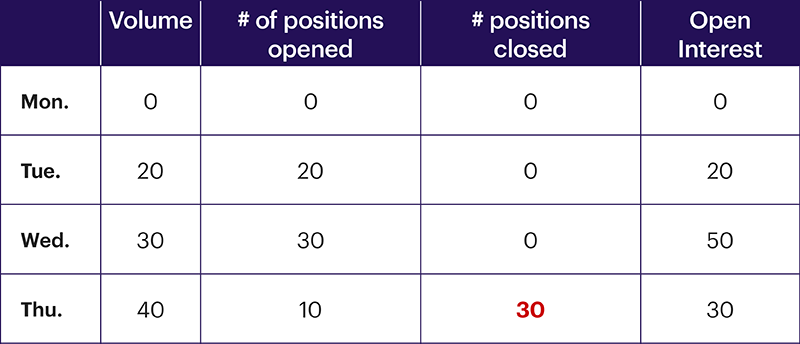
The following simplified example illustrates the interaction of volume and OI. Let’s say that on a Monday, no one had yet traded a particular call options contract, which means its volume and open interest would both be zero:
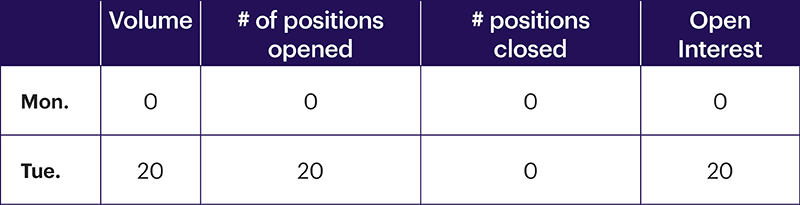
On Tuesday, 20 contracts traded, so both the volume and OI would be 20 at the end of the day:
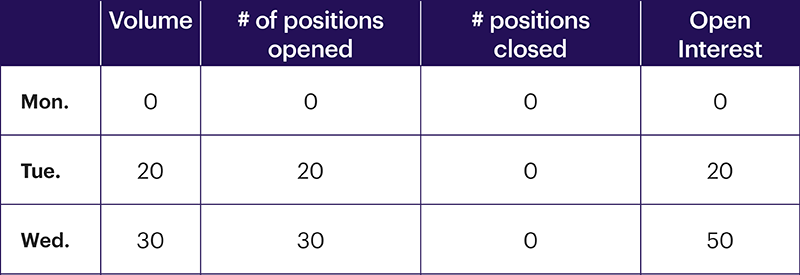
On Wednesday 30 more contracts traded, and all the buyers and sellers were establishing new positions. So, at the end of the day, the option’s OI would be 50:
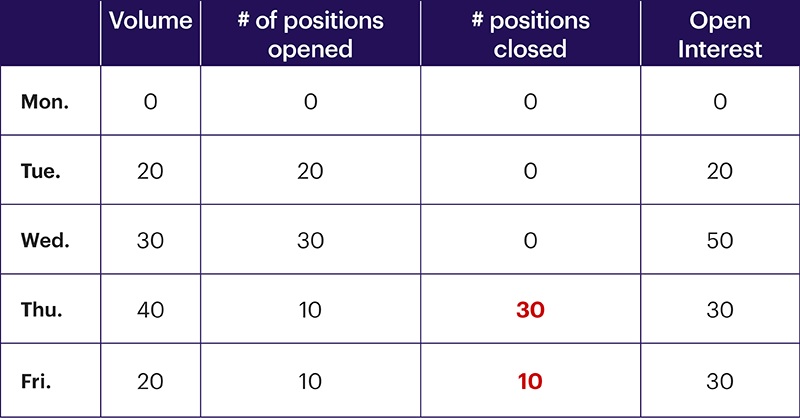
Then, on Thursday, the option’s volume was 40—the most active day of trading yet. But this time traders who already had positions liquidated 30 contracts, while the other 10 contracts represented new positions opened by other traders. In this case, the options OI would decrease by 20 (10 opening positions minus 30 closing positions), lowering the overall OI to 30:
So, although volume was heaviest on Thursday, participation in this contract actually decreased because traders closed more positions than they opened. Finally, on Friday volume was 20 contracts, 10 of which were new positions and 10 of which were liquidations of existing positions. The net result is that OI remains unchanged:
Bottom line, traders looking for liquid markets with heavy trader participation generally want to see high and/or increasing OI as well as high and/or increasing options volume.
Click here to log on to your account or learn more about E*TRADE's trading platforms, or follow the Company on Twitter, @ETRADE, for useful trading and investing insights.