Right forecast, wrong trade
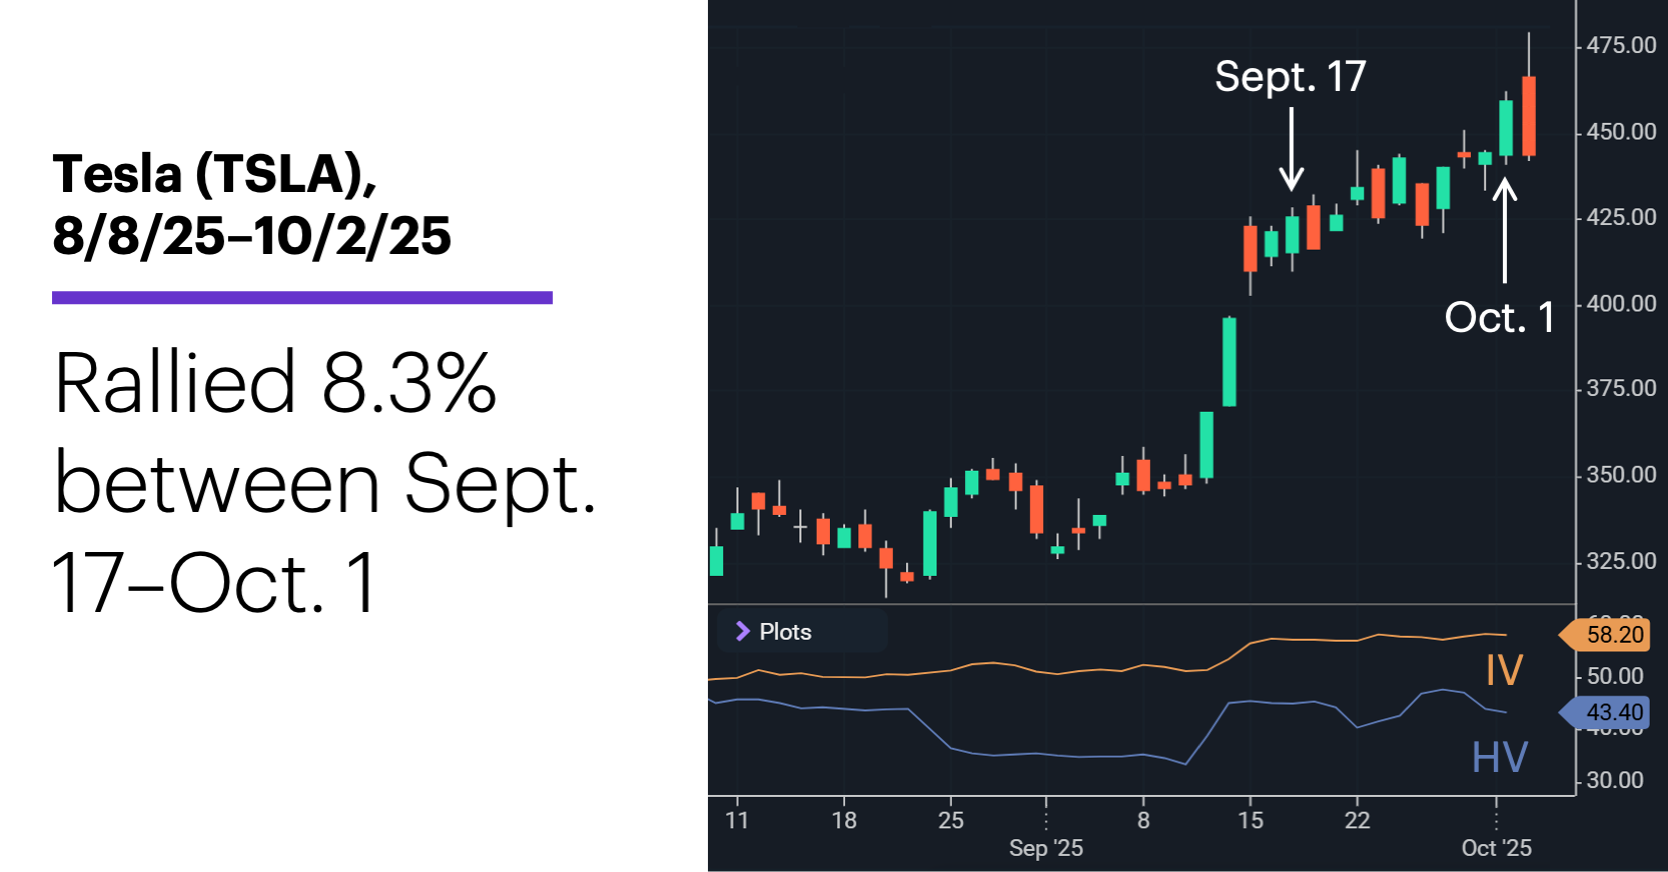
- TSLA up 8.3% between Sept. 17-Oct. 1
- Different strikes, different call options results
- Parsing October market patterns
Market forecasting is a difficult business, but even the best analysis can be upended by using the wrong strategy.
Consider the experiences of two hypothetical traders who bought Tesla (TSLA) call options on September 17 when the stock closed at what was then a record high of $425.86. Two weeks later, on October 1, TSLA had gained an additional 8%, closing at a fresh all-time high of $459.46:
Source: Power E*TRADE. (For illustrative purposes. Not a recommendation.)
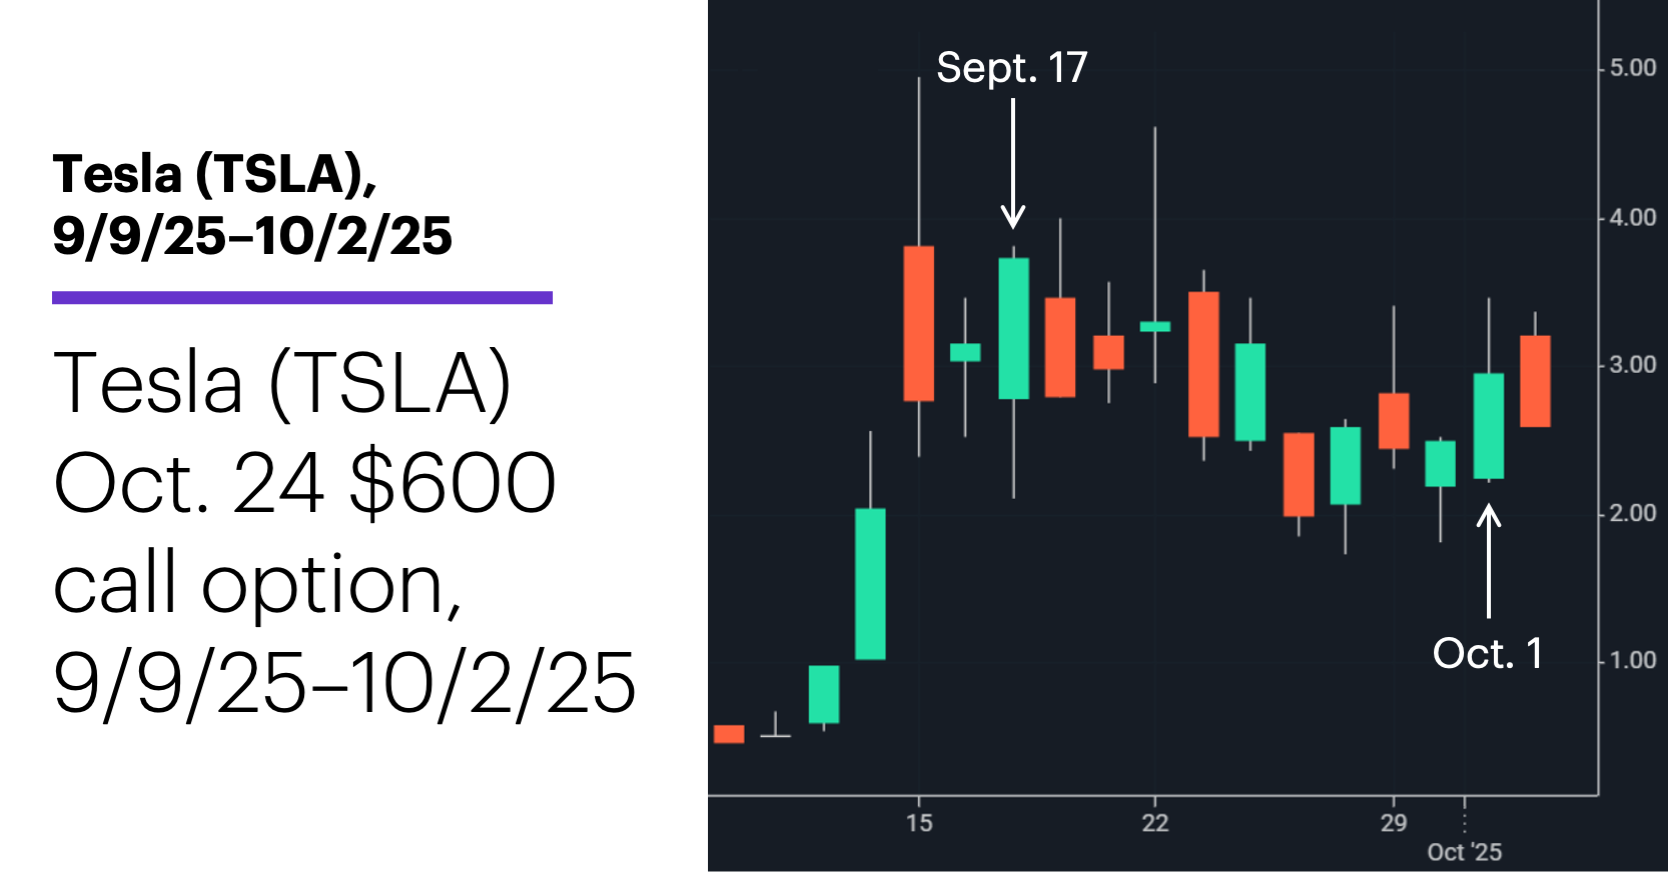
While this would appear to be good news for all call buyers, our traders used different contracts. Our first trader bought an at-the-money (ATM) $425 call expiring on October 24 for 34.95 ($3,495)—a hefty price tag, but probably not surprising given TSLA’s implied volatility (IV) was its highest level since June, and was well above the stock’s historical volatility (HV). In an effort to find a less-expensive trade, our second trader bought the deeply out-of-the-money (OTM) $600 call expiring on October 24 for 3.73 ($373).
Two long calls, two positions intended to capitalize on further gains in the underlying stock.
Now let’s see where things stood for both traders two weeks later. On October 1, the $425 call closed at 49.95—a 43% increase in the option’s value, and a $1,500 per-contract gain. But the outcome was much different for the $600 call:
Source: Power E*TRADE. (For illustrative purposes. Not a recommendation.)
This call closed at 2.95 ($295) on October 1—0.78 decline since September 17, despite the stock’s 8%-plus rally.
The difference: “delta,” or how much an option’s price changes relative to the underlying stock. ATM options (those with strike prices near the current stock price) typically have deltas around 0.5, or 50%. In other words, an ATM option would be expected to move $0.50 for every $1 move in the stock, up or down.
While deep in-the-money (ITM) options have higher deltas, OTM options like our $600 call have lower deltas, which means they won’t respond as much as ATM or ITM options to moves in the stock. For example, on October 2, the $425 call’s delta had increased to 0.64, while the $600 call’s delta was around 0.06—meaning this OTM call’s expected response to movement in the stock was less than one-tenth that of the $425 call.
And that’s how two traders who correctly forecast the same market can end up with very different results. Traders need to select “the right tool for the job”—options with delta, time decay, and volatility characteristics that fit the forecast for the stock.
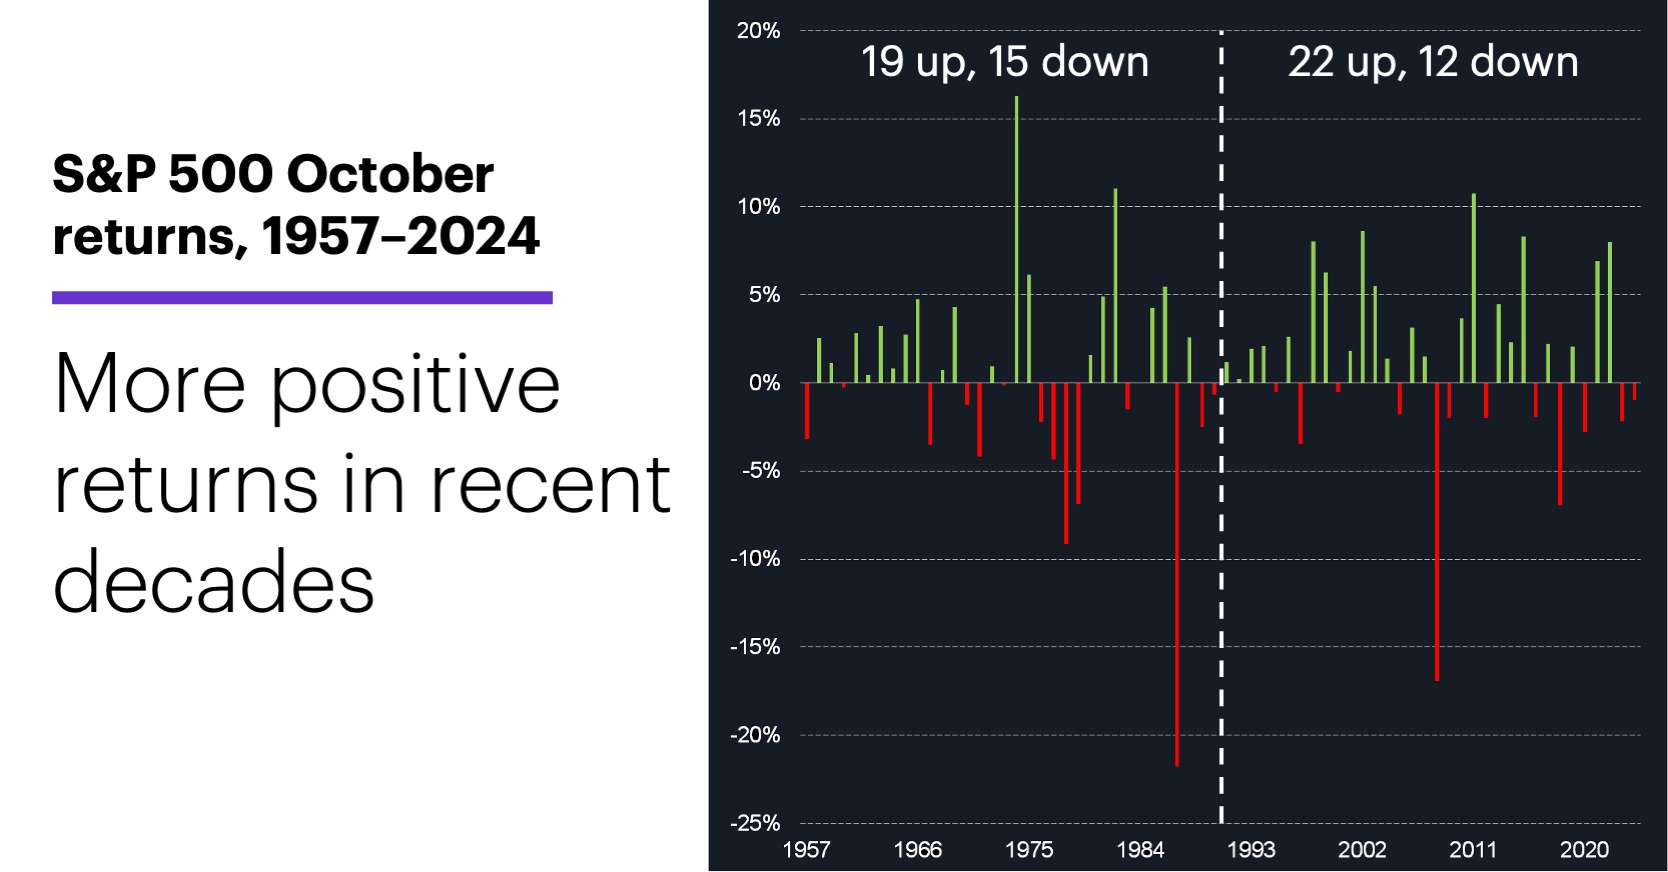
October market patterns: Despite hosting some of the market’s highest-profile sell-offs over the years, October has actually been a solidly positive month for US stocks since 1957, especially in recent decades.
From 1957-1990, October was an up month for the S&P 500 (SPX) 19 times and a down month 15 times. Since 1991, it’s been up 22 times and down 12:
Source: Power E*TRADE. (For illustrative purposes. Not a recommendation.)
However, October’s reputation for volatility is not undeserved. Even during the more bullish 1991-2024 window, October had the largest average SPX intramonth drawdown (i.e., the percentage move from the previous month’s close to the lowest low of the current month). It also had the highest average “true range,” which measures the month’s maximum move, up or down, from the previous month’s close.
The important thing to remember, though, is that while many traders and investors think of “volatility” exclusively in terms of a falling market, it really refers to the level of price movement, up or down. In other words, while October has a history of larger-than-average intramonth price swings, some of those swings have been to the upside.
Today’s numbers include (all times ET): S&P Global PMI Composite (9:45 a.m.), ISM Services Index (10 a.m.).
Click here to log on to your account or learn more about E*TRADE's trading platforms, or follow the Company on Twitter, @ETRADE, for useful trading and investing insights.